Top Dashboards
Top dashboards show top virtual infrastructure objects for resource usage. There are three top dashboards available in the root Veeam for Hyper-V folder:
- Top Hosts
- Top Clustered Storage
- Top SMB Storage
- Top Virtual Machines
One additional top dashboard is within the Storage subfolder of views — Top Local Storage.
Example screenshot below shows the top hosts for CPU usage, memory usage, memory pressure and memory pages/sec.
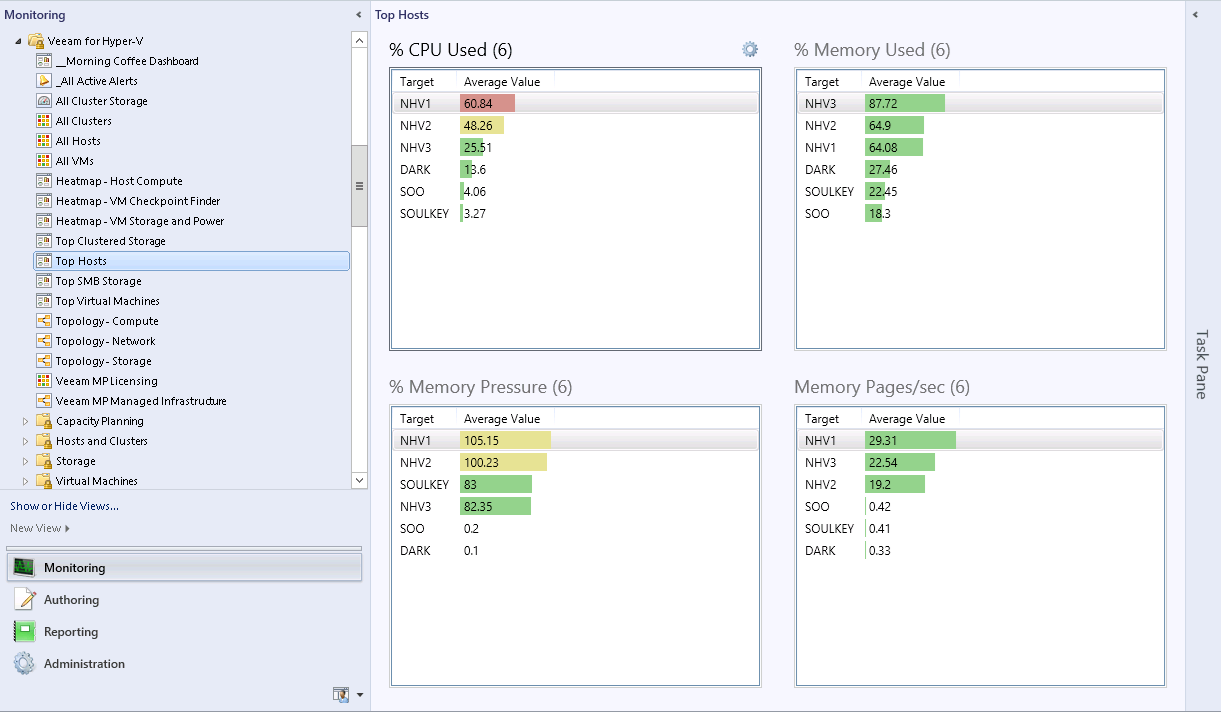
To speed up performance analysis and identify infrastructure objects with performance issues, Veeam Top Dashboards feature Traffic Lights functionality — that is, warning and critical thresholds that are used to color objects in the widgets. For example, the screenshot above shows that one host is in yellow (warning) state for % Memory Used, and one host is in red (critical) state.
Note |
Performance data in Top dashboards is averaged over the last 4 hours. |
The bars on the charts will be highlighted with traffic light colors:
- If the Critical threshold is breached, performance metric value will be highlighted with Red
- If the Warning threshold is breached, performance metric value will be highlighted with Yellow
- If the none of the thresholds is breached, performance metric value will be highlighted with Green
The default configuration of the traffic light widgets can be customized. For details on changing widget settings, see section Personalizing Veeam Dashboard Widgets.