Personalizing Traffic Lights Widgets
You can enable the traffic light feature for Top Dashboard widgets, or change the default widget thresholds:
- Open a Top Dashboard.
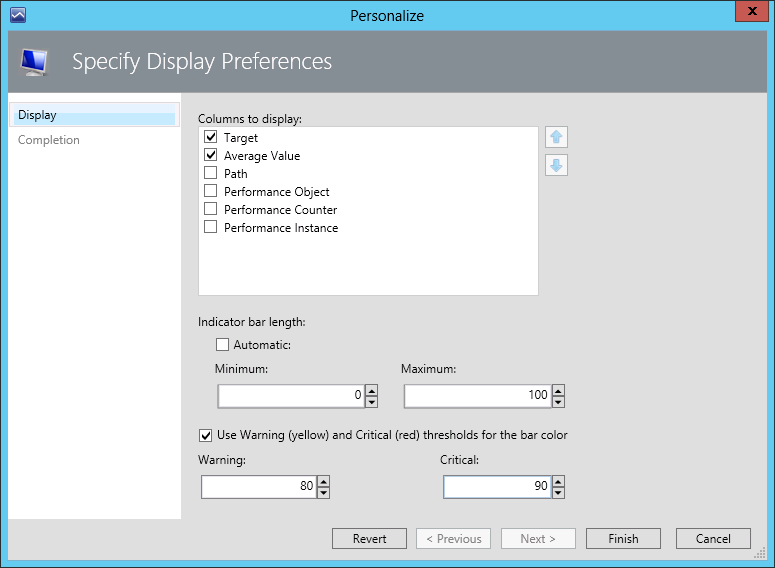
- Click the gear icon to the right of the widget name and select Personalize.
- Select the Use Warning (yellow) and Critical (red) thresholds for the bar color check box.
- Specify values for the Warning and Critical thresholds.
- Click Finish.
As a result, the bars on the charts will be highlighted with traffic light colors:
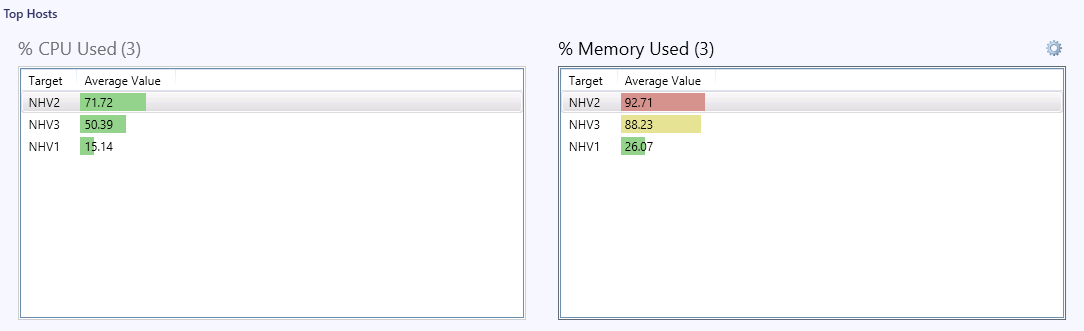
- If the Critical threshold is breached, performance metric value will be highlighted with Red.
- If the Warning threshold is breached, performance metric value will be highlighted with Yellow.
- If none of the thresholds is breached, performance metric value will be highlighted with Green.
For example, the screenshot below shows the Top Hosts dashboard with the % CPU Used and % Memory Used metrics set to 80% for Warning and 90% for Critical thresholds.
To return back to the default widget settings, choose to personalize the widget and click Revert.