Traffic Light Widget
This widget shows top or bottom infrastructure objects for the selected performance metric.
Sample Usage
This section provides step-by-step instructions that will help you understand how to use the Traffic Light widget. Consider the following example:
You need to analyze the number of running VMs on hosts and make sure this number does not exceed 15.
In a dashboard, click to add a new widget and follow the next steps:
- At the Template step, choose Veeam > Veeam Traffic Light Widget.
- At the General Properties step, specify widget display name and description.
- At the Scope and Counters step, choose what infrastructure objects will be included in the widget scope and what counter should be analyzed:
- In the Select a group or object field, choose the Veeam Hyper-V Hosts Group.
- In the Select a performance counter (Object/ Counter/ Instance) field, choose Hyper-V Hypervisor / VM Running / _Total.
- At the Time Range and Results step, leave the default interval settings.
- At the Display step, specify traffic lights color settings.
Select the Use warning (yellow) and critical (red) thresholds for the bar color check box. In the Warning field, enter 10; in the Critical field, enter 15.
- Click Create.
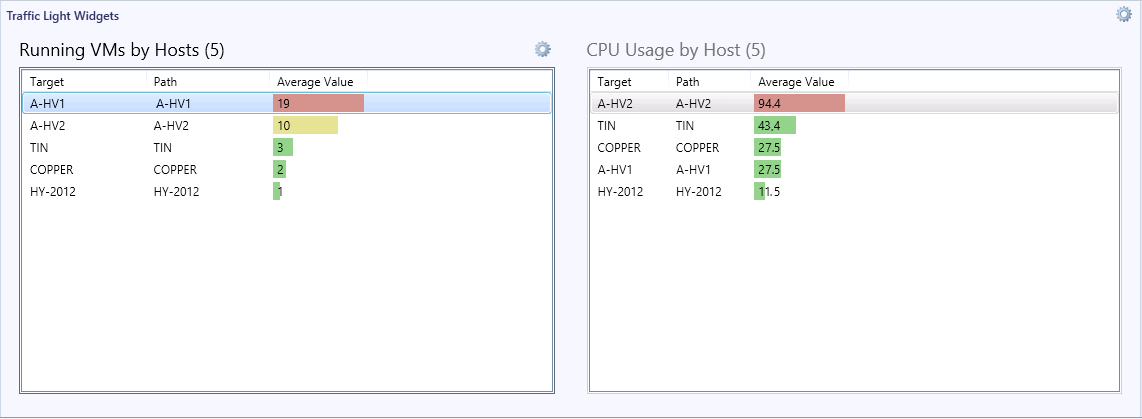
As a result, the widget will show hosts sorted by running VMs:
- Hosts with more than 15 VMs will be highlighted red
- Hosts with 10 to 15 running VMs will be highlighted yellow
- Hosts with less than 10 running VMs will be highlighted green
Veeam MP for Hyper-V also allows you to configure the thresholds for predefined Top dashboards. For details, see Top Dashboards.