Report Output
The Virtual Infrastructure Described table will provide an overview for all clusters included in the report scope: number of hosts, amount of CPU and memory resources, number of VMs (total, active, shutdown and paused).
The Sample Workload Described table will provide an overview for the virtual machines used as a sample for calculating the number of VM sets: total number of VMs, total vCPUs, total CPU usage, memory usage and storage usage and number of IOPS.
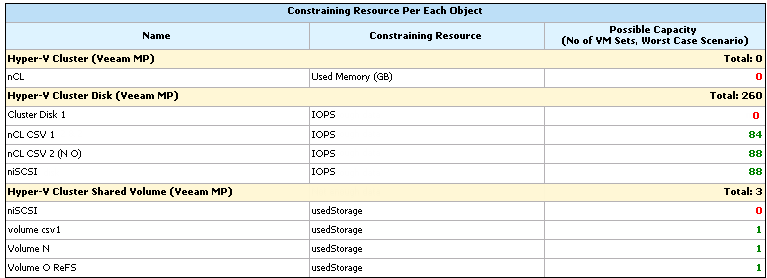
The Constraining Resource per Each Object table will provide the resource for which the specified threshold will be breached first within the forecast period, and will show the number of VMs of the specified profile that your cluster will be able to support.
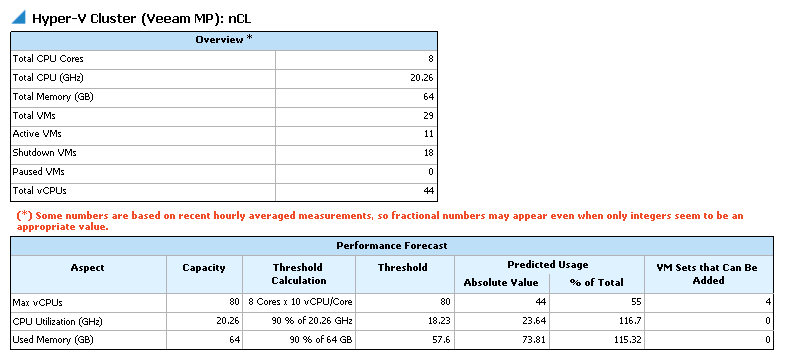
The Hyper-V Cluster table will show an overview of cluster compute resources, and the number of VMs within the cluster (total, active, shutdown, paused).
The Performance Forecast table reveals the predicted CPU and memory utilization and shows many VMs you can add in terms of compute resources, taking into account available resources in future.
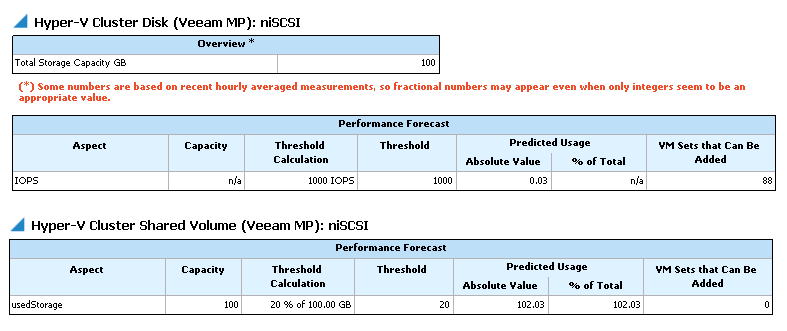
The Performance Forecast tables reveal the predicted free space usage and IOPS numbers and shows how many VMs you can add, taking into account available resources in future.


