Report Output
The report will provide summary information on the selected infrastructure scope: the total number of SCVMM Servers (if present), clusters, hosts, VMs, SMB shares and CSVs, as well as total CPU, memory and disk resources.
The Virtual Infrastructure Density table will show the following consolidation ratios:
- Host : Cluster ratio — the average number of hosts in a cluster;
- VM : Host ratio — the average number of VMs running on a host;
- vCPU : CPU ratio — the average number of vCPUs configured for a single physical processor;
- VM : Storage device ratio — the average number of VMs on a CSV or SMB share.
The Top 10 Guest Operating Systems table will show a list of guest operating systems installed on VMs in your environment.

Details tables will display configuration properties of SCVMM Servers, clusters, CSVs, SMB shares and host systems. For each CSV and SMB share, the report will also provide information on its capacity and the amount of provisioned, used and free space.
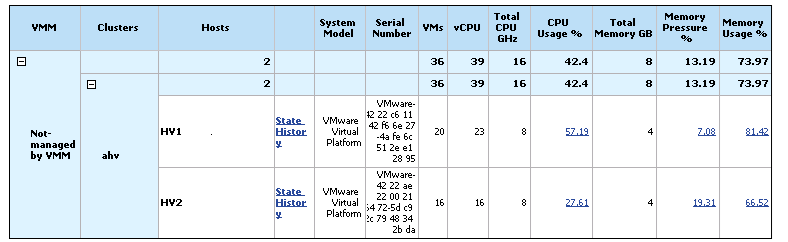
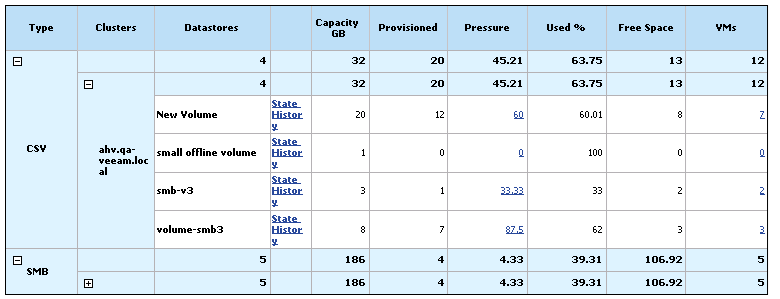
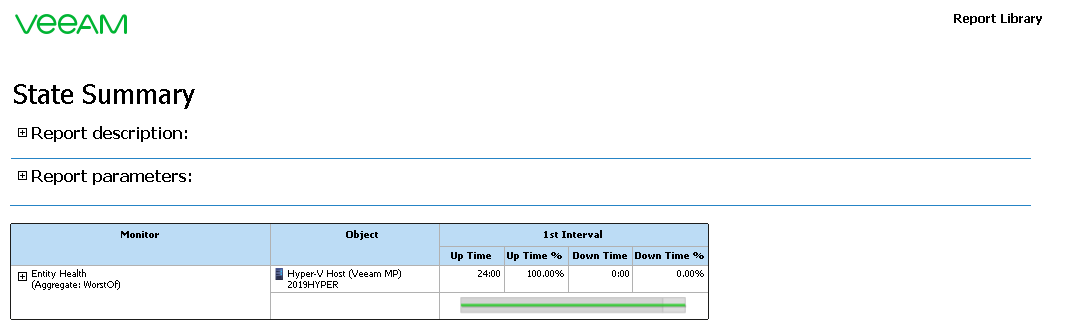
You can click the State History link in a details table to drill down to the Veeam State Summary Report and review uptime and downtime statistics for the infrastructure object.
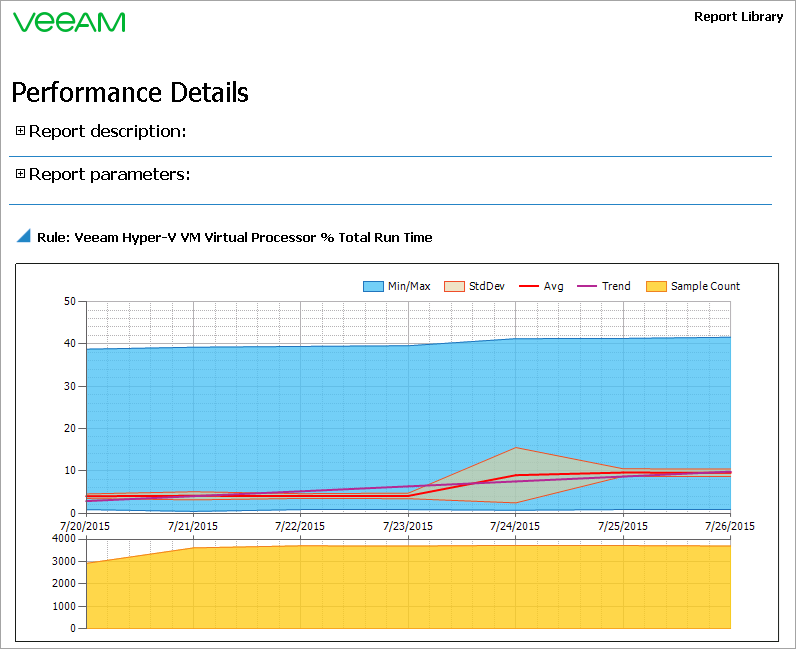
You can click a number in the CPU Usage %, Memory Pressure %, Memory Usage %, Pressure or VMs column of a details table to drill down to performance details for the infrastructure object.