Personalizing Heatmap Widgets
To change the default settings for a Heatmap widget:
- Open a Heatmap Dashboard.
- Click the gear icon to the right of the widget name and select Personalize.
- Clear the Automatic (the maximum value will be used for Red) check box.
- Specify values for the Minimum and Maximum thresholds.
- Select the Display the color range bar and value range below the widget check box to show a legend bar with threshold below the heatmap.
- Click Finish.
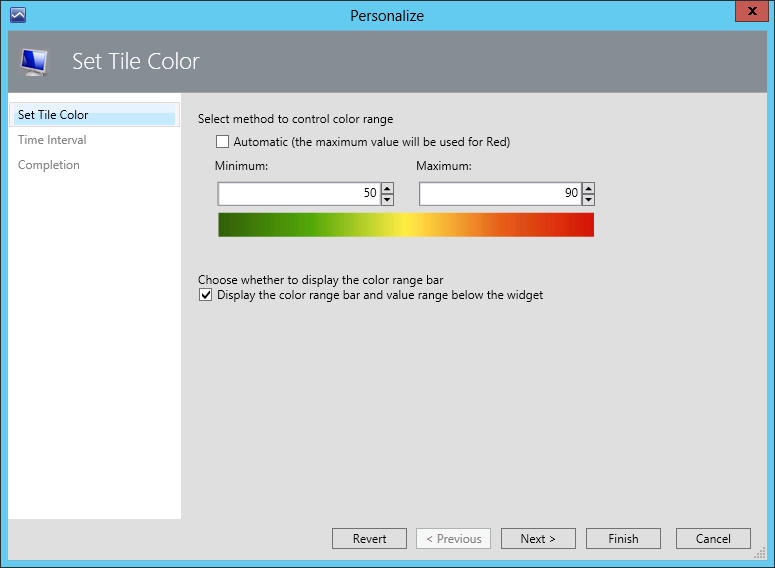
As a result, the object tiles on the heatmap will be highlighted as follows:
- If the Minimum threshold is breached, an object on the heatmap will be highlighted with Yellow.
- If the Maximum threshold is breached, an object on the heatmap will be highlighted with Red.
- If none of the thresholds is breached, an object on the heatmap will be highlighted with Green.
- If no metric value is available, an object on the heatmap will be highlighted with Gray.
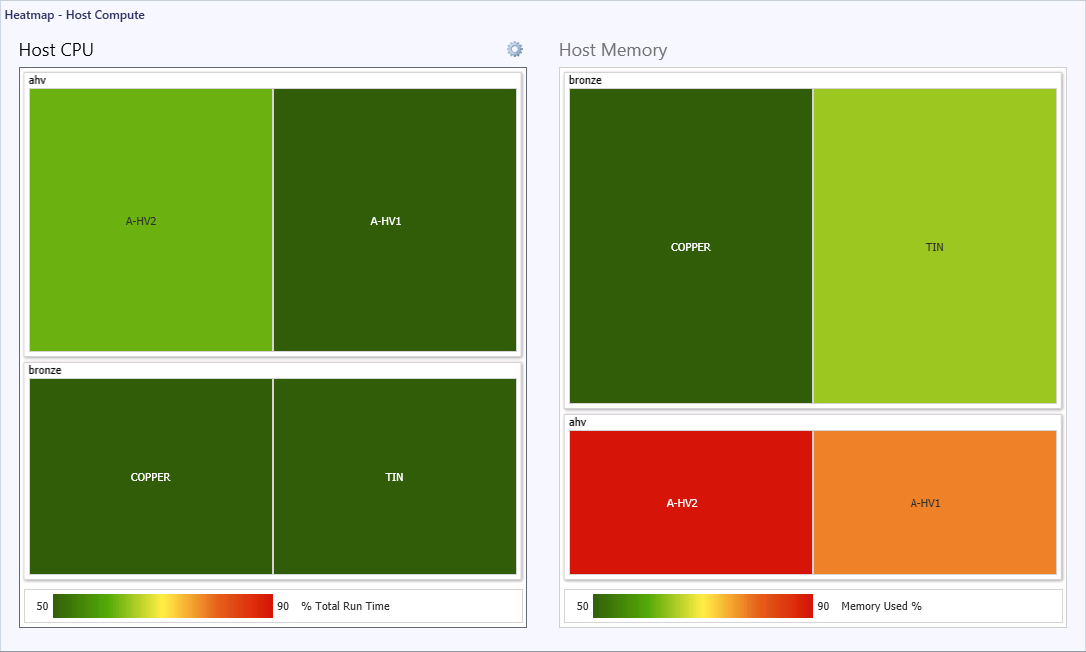
For example, the screenshot below shows the Heatmap - Host Compute dashboard with thresholds set for the Host CPU and Host Memory metrics.
To return back to the default widget settings, choose to personalize the widget and click Revert.