Report Output
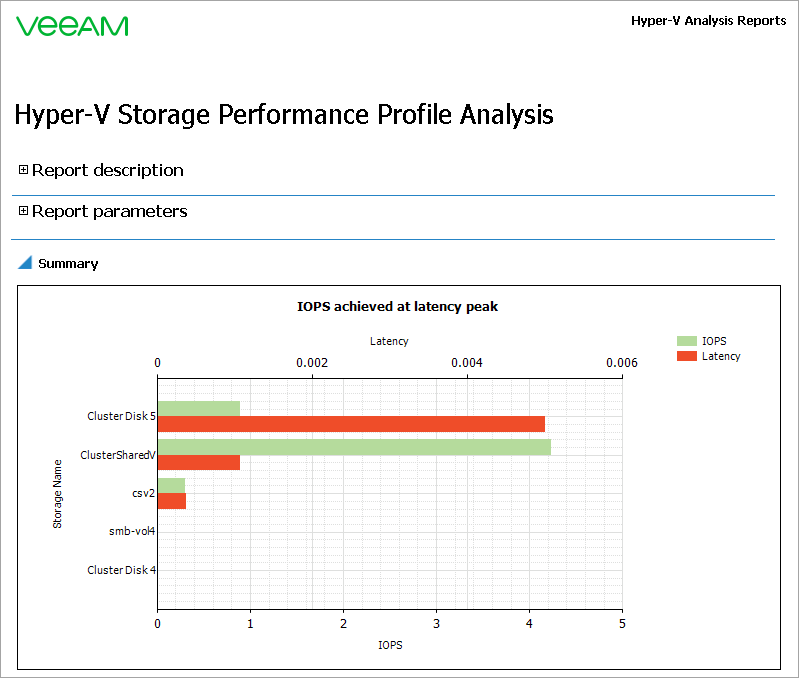
The IOPS achieved at latency peak chart will show 5 most loaded cluster disks and volumes. For each disk or volume, the chart shows the worst latency value reported within the selected period and the IOPS value that was achieved during this latency peak.
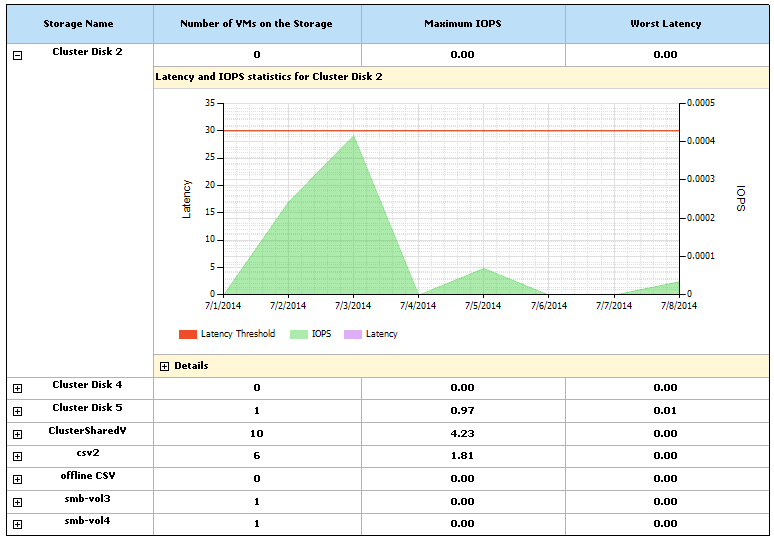
The details table will show the total number of VMs hosted on the cluster disk/volume, the maximum number of IOPS reported for the selected period and the highest latency value reported for the selected period.
The Latency and IOPS statistics section will provide day-by-day latency and IOPS values and show whether (and when) the defined latency threshold has been breached.