Report Output
The report will show the list of virtual machines that stayed idle longer than half of the reporting period. Particularly, these are VMs whose maximum CPU usage was reported below 1000 MHz, and maximum memory usage way reported below 1000 MB for at least 3 days of the week.

The Summary doughnut charts will show the following information:
- Total number of idle, switched-off and normal VMs (“normal” are VMs that are neither idle, nor switched-off): it can be seen from the output, that during the week there were only 7 idle VMs, 1 normal and 10 switched-off VMs.
- Total CPU, memory, network and disk usage for idle and normal VMs
- Total storage consumption for idle, normal and switched-off VMs: in this example, idle VMs consumed 17.05 GB, normal VMs — 6.78 GB, and switched-off VMs — 0.15 GB.
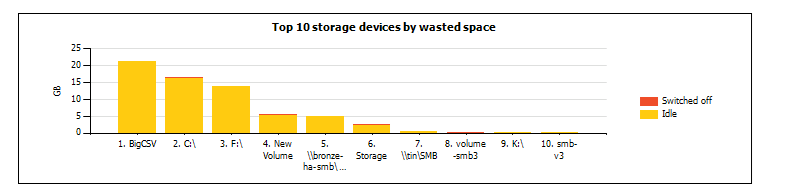
The Top 10 storage devices by wasted space chart will show 10 volumes with the highest amount of storage consumed by idle, switched-off and normal VMs.
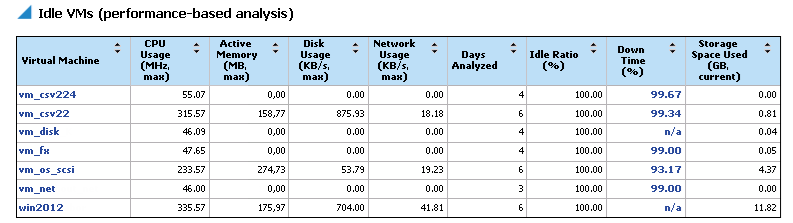
The details table will show the following information for idle VMs: CPU, disk and network usage, active memory, percentage of time when the VM was in the idle state (that is, idle ratio), percentage of time when the VM was in the Critical state (Critical state means that the VM was powered off or non-operating) and storage space allocated.
You can click a VM name in the report table to analyze how the amount of consumed CPU, memory, network and storage resources was changing for the VM during the week.
You can also click the link in the Down Time (%) column to drill down to uptime details for the VM for this week.