Report Output
The Virtual Infrastructure Described table will provide an overview for a cluster included in the report scope: number of hosts, number of VMs (total, active, shutdown and suspended) and total CPU and memory usage values.
The Performance Forecast Analysis and Recommendations table will provide details and recommendations for the resource whose utilization threshold will be breached first within the forecast period.
The Overall Recommendations table will provide recommendations for the cluster included in the report scope.
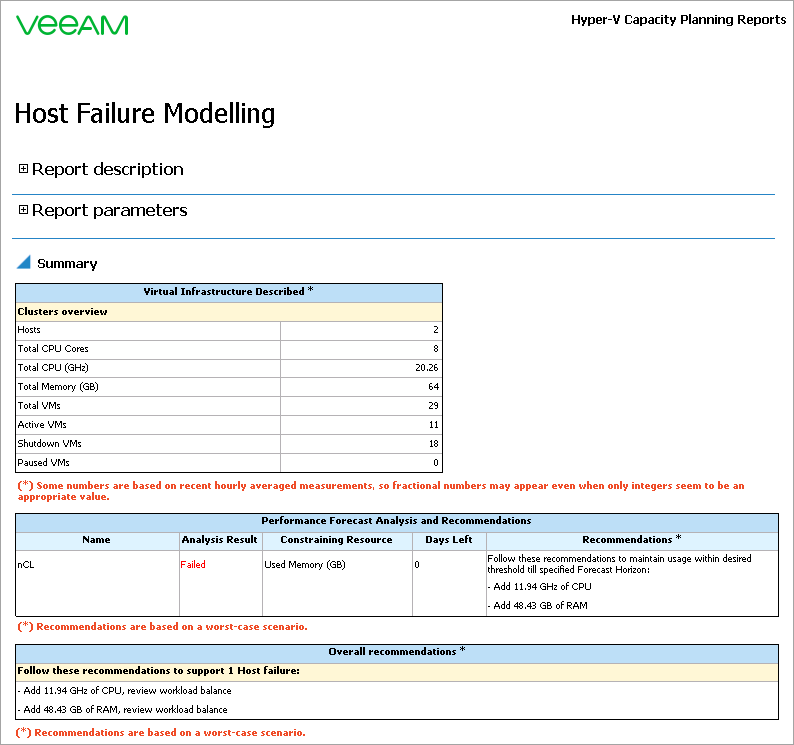
In this example, the cluster is reported to run out of CPU and memory if one of the hosts fails. The number of Days Left shows 0, which means that the cluster will not be able to sustain the current workload. The Recommendation section provides practical recommendations for maintaining the resource usage within the desired threshold.
The doughnut charts will represent the number of removed and remaining hosts and amount of removed and remaining resources in the simulated scenario.
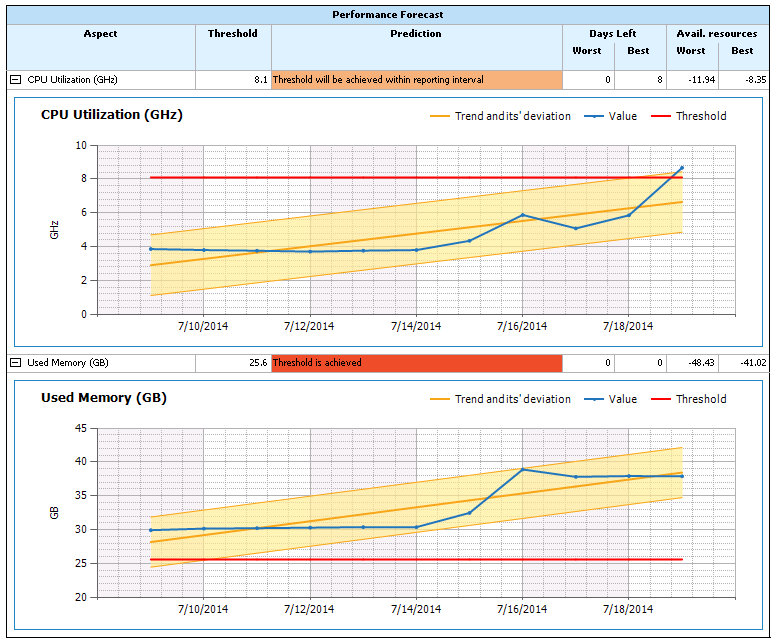
The Performance Forecast table reveals whether the specified thresholds will be breached and details the following forecasted values (all values are provided for both the best-case and the worst-case scenarios):
- Days Left: number of days after which CPU and memory utilization thresholds will be breached
- Available resources: amount of resources that will remain unused on the forecast horizon date (available resources, calculated as the difference between the threshold and the predicted resource usage)
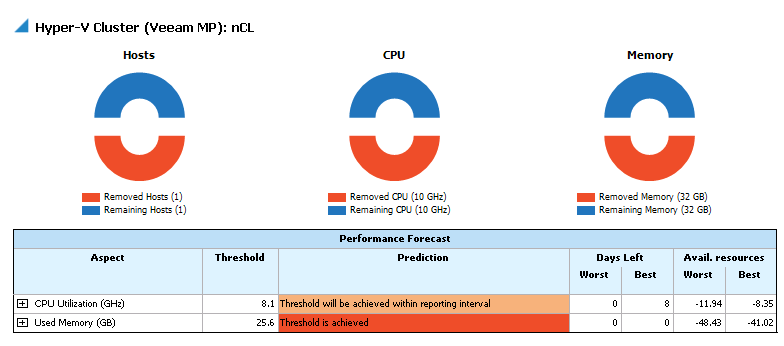
In this example, the report provides the following forecasts:
- CPU utilization threshold will be breached within the reporting period.
- Memory usage threshold will be breached immediately after the host failure.
You can expand the table rows to open charts detailing actual CPU and memory utilization values, calculated utilization trend and its deviation, and the threshold.