Heatmap Widget
This widget allows you to compare performance metric or property values for several objects. Objects in the heatmap are represented with tiles, the size and color of the tiles reflects the value of performance counters.
Sample Usage
This section provides step-by-step instructions that will help you understand how to use the Heatmap widget. Consider the following example:
You need to analyze the amount of available and free space for host local volumes and make sure that there is at least 10% of free space left on the volumes.
In a dashboard, click to add a new widget and follow the next steps:
- At the Template step, choose Veeam > Veeam Heatmap Widget.
- At the General Properties step, specify widget display name and description.
- At the Scope step, choose what infrastructure objects will be included in the widget scope:
- In the Select a scope to contain all objects used in the heatmap box, add the Veeam Hyper-V Clusters Group.
- In the Select a class to Group the tiles on the heatmap field, choose Hyper-V Host Disks Container.
- In the Select a class to be used for each Tile on the heatmap field, choose Hyper-V Host Local Volume.
Note |
The Heatmap widget has a known limitation for the list of groups and objects selected as a scope. If you add several groups and objects in the widget scope, make sure they include containers and tile object classes. Otherwise, the widget may start working incorrectly. |
- At the Set tile size step, choose a counter that will define the size of tiles on the heatmap.
To follow this example, choose Total Storage Capacity GB.
- At the Set tile color step, specify color settings for the heatmap:
- In the Select counter or property to control Tile color field, select % Free Space.
- In the Select method to control color range section, clear the Automatic (the maximum value will be used for Red) check box.
- In the Minimum field, specify 100, in the Maximum field, specify 10.
- At the Time Interval step, leave the default interval settings.
- Click Create.
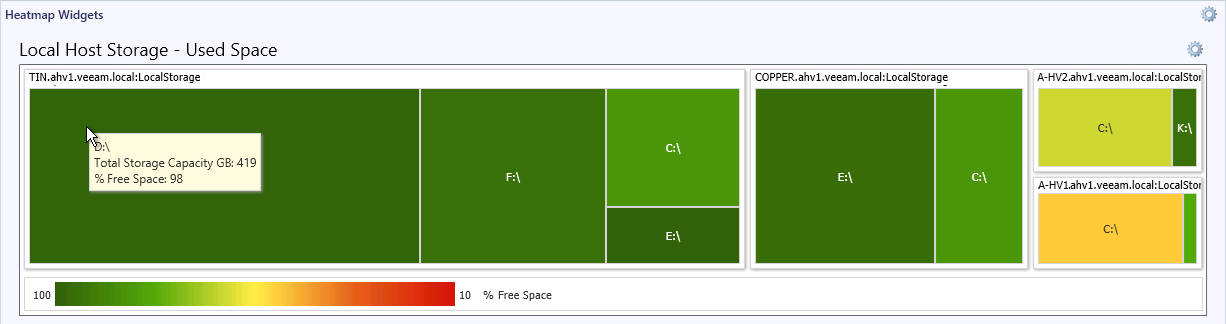
As a result, the widget will show host local volumes as tiles for each host:
- The tile size will represent the total amount of volume space.
- The tile color will represent the amount of free space left on the volume; volumes that have less than 10% free space left will be colored red.
Veeam MP for Hyper-V also includes default dashboards with the preconfigured Heatmap widgets. For details, see Heatmap Dashboards.