Report Output
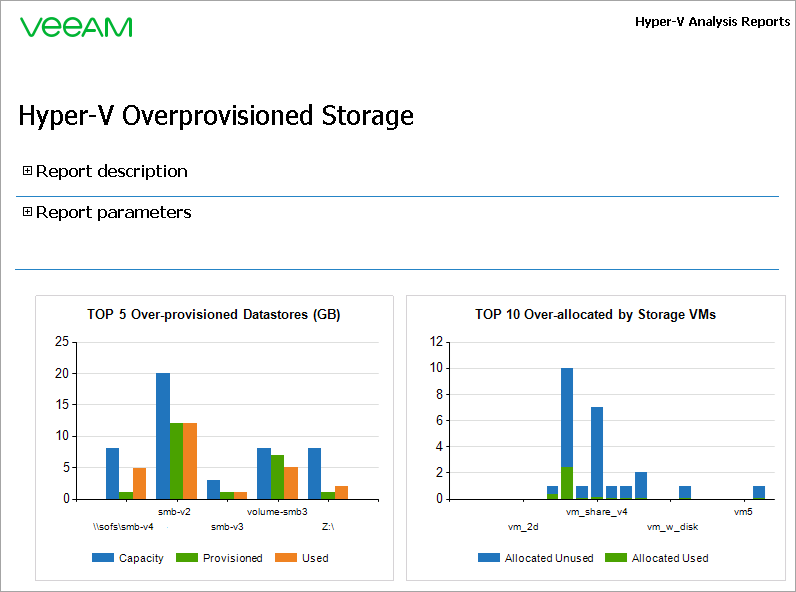
The TOP 5 Over-provisioned Datastores (GB) chart will show 5 most over-provisioned storage objects, and graphically display the difference between capacity, provisioned and used space. The TOP 10 Over-allocated by Storage VMs chart will show 10 VMs with excessive amount of allocated space, and graphically display the difference between allocated used and unused space.
In this example, the report shows that the most over-provisioned storage of the previous month was smb-v2, while the vm_share_v4 VM had the greatest amount of unused allocated space.
For each storage object, details tables will provide information on the number of VMs residing on disk, free and provisioned space, capacity, disk pressure and the percentage of provisioned space that is actually used.
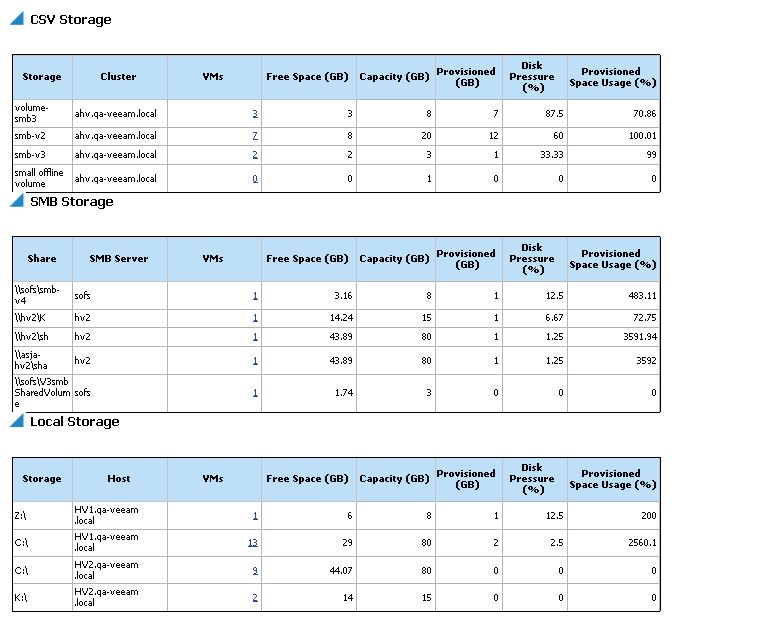
You can click a number in the VMs column of a details table to drill down to performance charts and statistics on storage space usage.