 This is an archive version of the document. To get the most up-to-date information, see the current version.
Hyper-V Trends
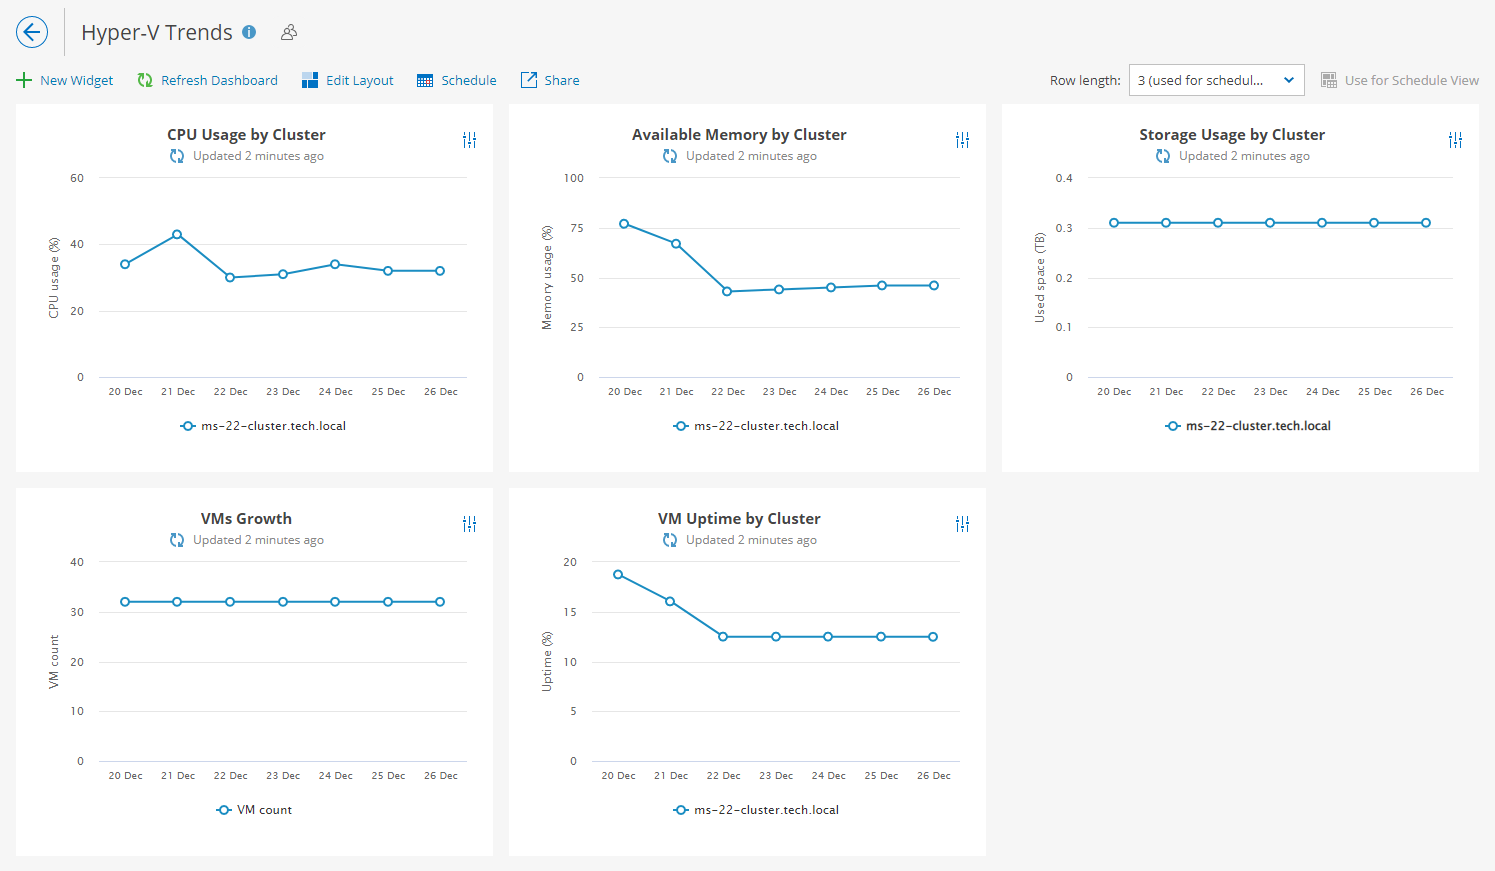
The Hyper-V Trends dashboard helps you track resource utilization in the Microsoft Hyper-V infrastructure by displaying growth trends for the previous week.
Widgets Included
- CPU Usage by Cluster
This widget shows how CPU utilization in a cluster has been changing during the week.
- Available Memory by Cluster
This widget shows how memory utilization in a cluster has been changing during the week.
- Storage Usage by Cluster
This widget shows how storage utilization in a cluster has been changing during the week.
- VMs Growth
This widget shows how the number of VMs in your virtual infrastructure has been changing during the week.
- VM Uptime by Cluster
This widget shows how the average uptime value for VMs in a cluster has been changing during the week.