Veeam Threat Center Dashboard
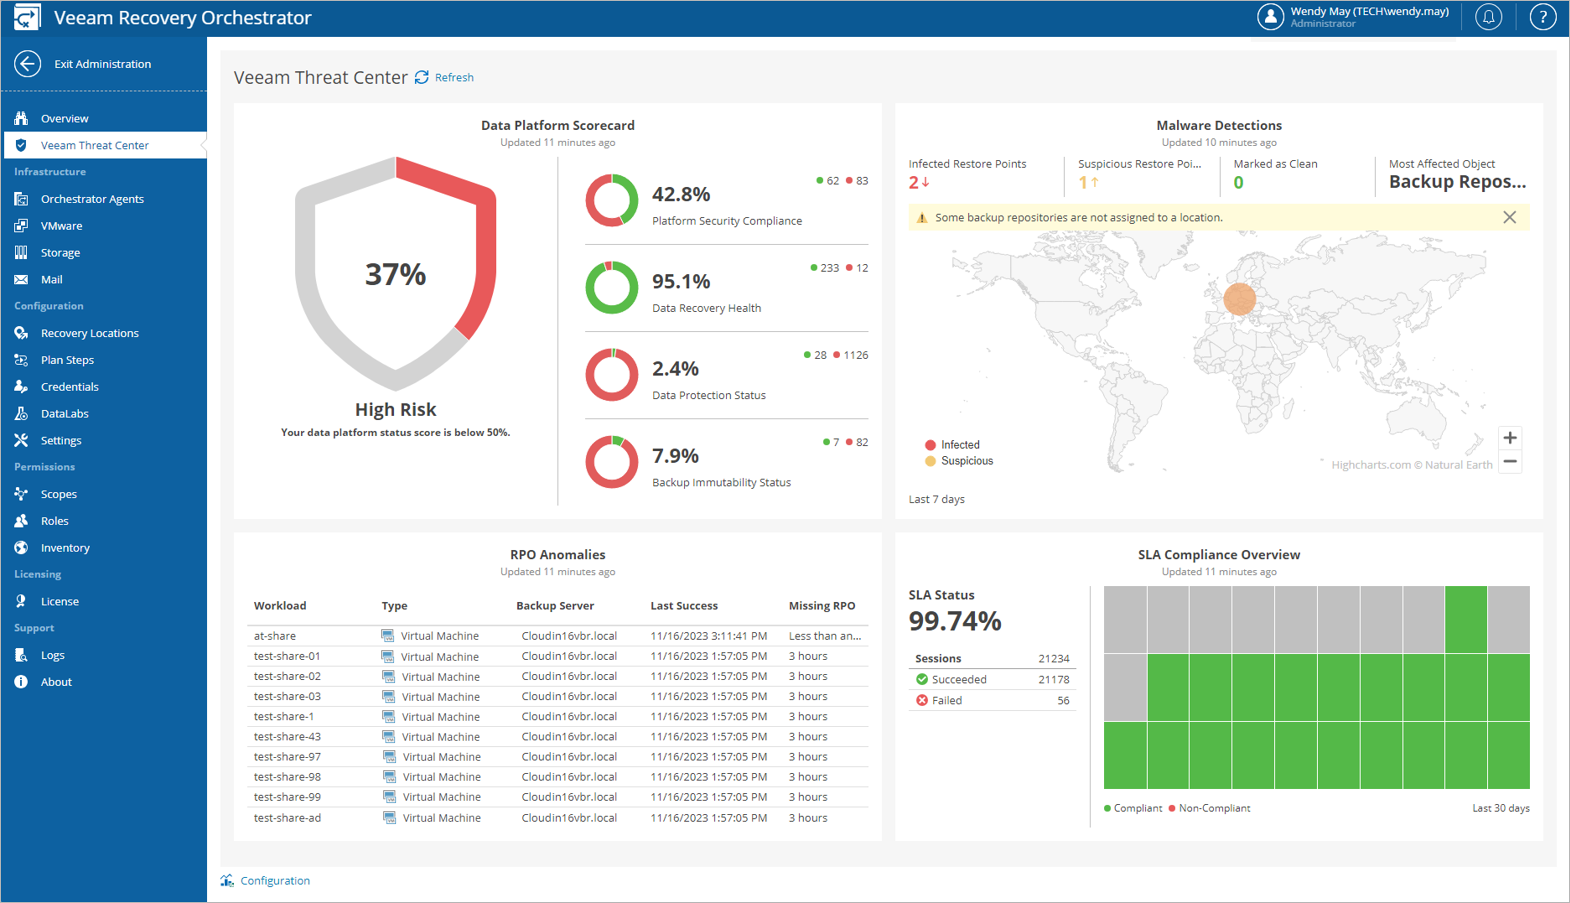
The Veeam Threat Center dashboard on the Administration tab of the Orchestrator UI provides at-a-glance real-time overview of your infrastructure security based on the information collected from Veeam ONE:
- The Data Platform Scorecard chart displays the security status of your Veeam Data Platform. To view a detailed report on each aspect that is taken into account when evaluating the overall security level, click Configuration at the bottom of the Veeam Threat Center page.
- The Malware Detections chart displays possible malware that has been detected in different geographic locations within the specified time period. The chart shows the number of restore points marked as Clean, Suspicious and Infected, as well as objects that contain the majority of infected restore points. For the affected objects to be displayed on the chart, these objects must be assigned a specific location in Veeam ONE as described in the Veeam ONE Reporting Guide User Guide, section Veeam Threat Center.
- The RPO Anomalies chart displays workloads included in recovery plans that have recently completed with RPO failures.
- The SLA Compliance Overview chart displays the percentage of backup sessions that have recently completed successfully within the desired RPO. For SLA compliance statistics to be displayed on the chart for a Veeam Backup & Replication server, the server must be added to Orchestrator as described in section Connecting Veeam Backup & Replication Servers.
For more information on the charts, see the Veeam ONE Reporting Guide.