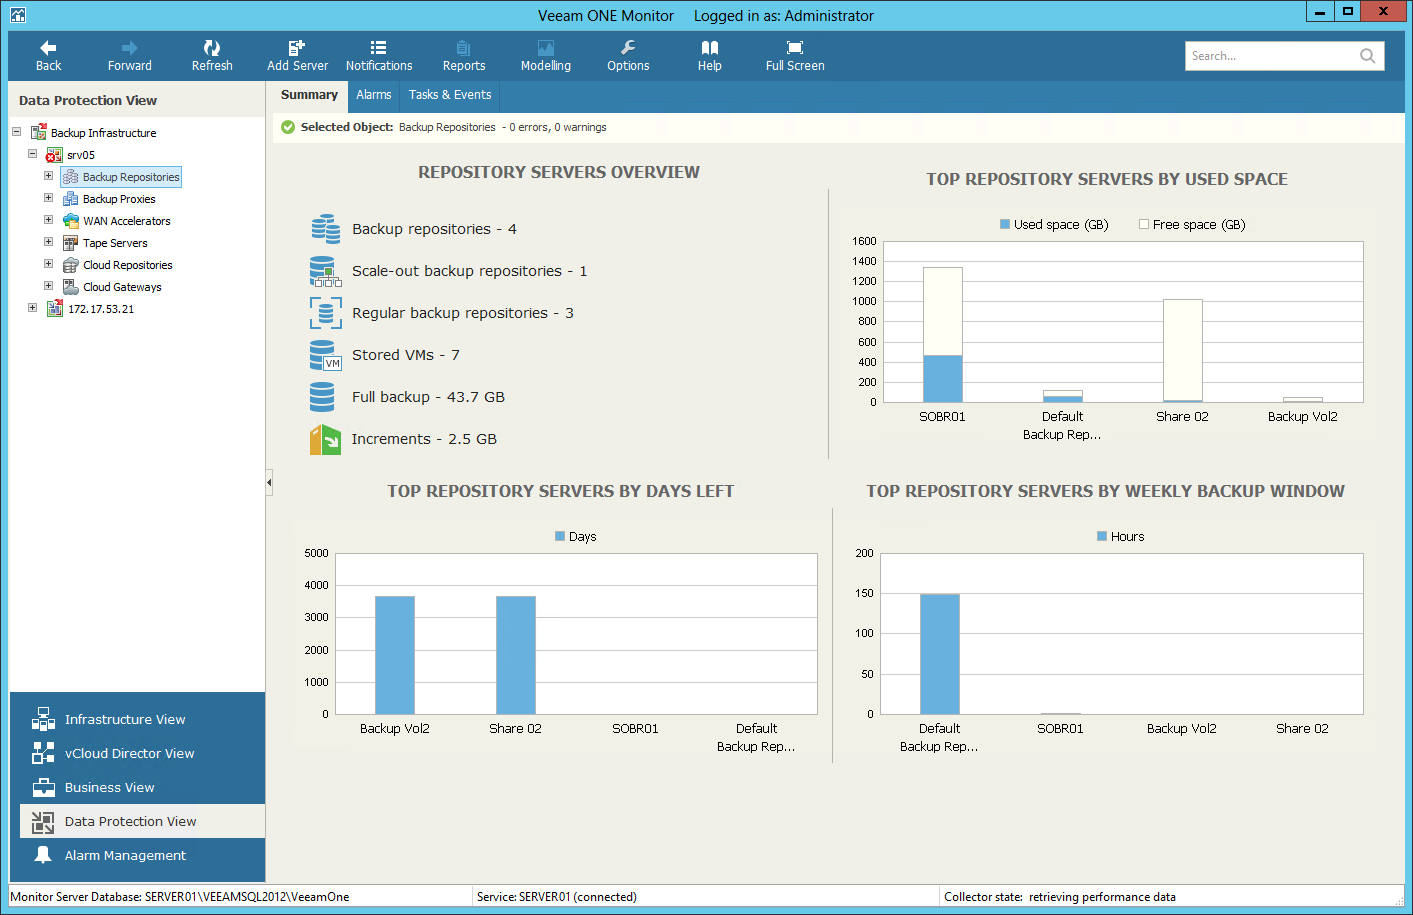
The summary dashboard for the Repositories node provides a configuration overview and performance analysis for backup repositories managed by a Veeam Backup & Replication server.
The Repository Servers Overview section outlines the following details:
- The total number of repositories managed by the Veeam Backup & Replication server
- The number of scale-out backup repositories
- The number of regular backup repositories
- The number of virtual machines in backups on the repositories
- Cumulative amount of storage space occupied by full VM backups
- Cumulative amount of storage space occupied by incremental VM backups
The Top Repository Servers by Used Space chart shows 5 backup repositories with the greatest amount of used storage space. For every repository in the chart, you can see the amount of used storage space against the amount of available space. If free space on the repository is running low, you might need to take some anticipatory action — for example, free up storage space on the repository, revise your backup retention policy.
The Top Repository Servers by Days Left chart shows 5 backup repositories that can run low on storage space sooner than others. To draw the chart, Veeam ONE Monitor analyzes historical data and checks how fast free space on repositories has been decreasing in the past. Veeam ONE Monitor uses this historical statistics to forecast how soon the repository will run out of space.
The Top Repository Servers by Weekly Backup Window chart allows you to detect the most ‘busy’ repositories over the past 7 days. For every repository, the chart shows the cumulative amount of time that the repository was busy with backup and backup copy job tasks.


