
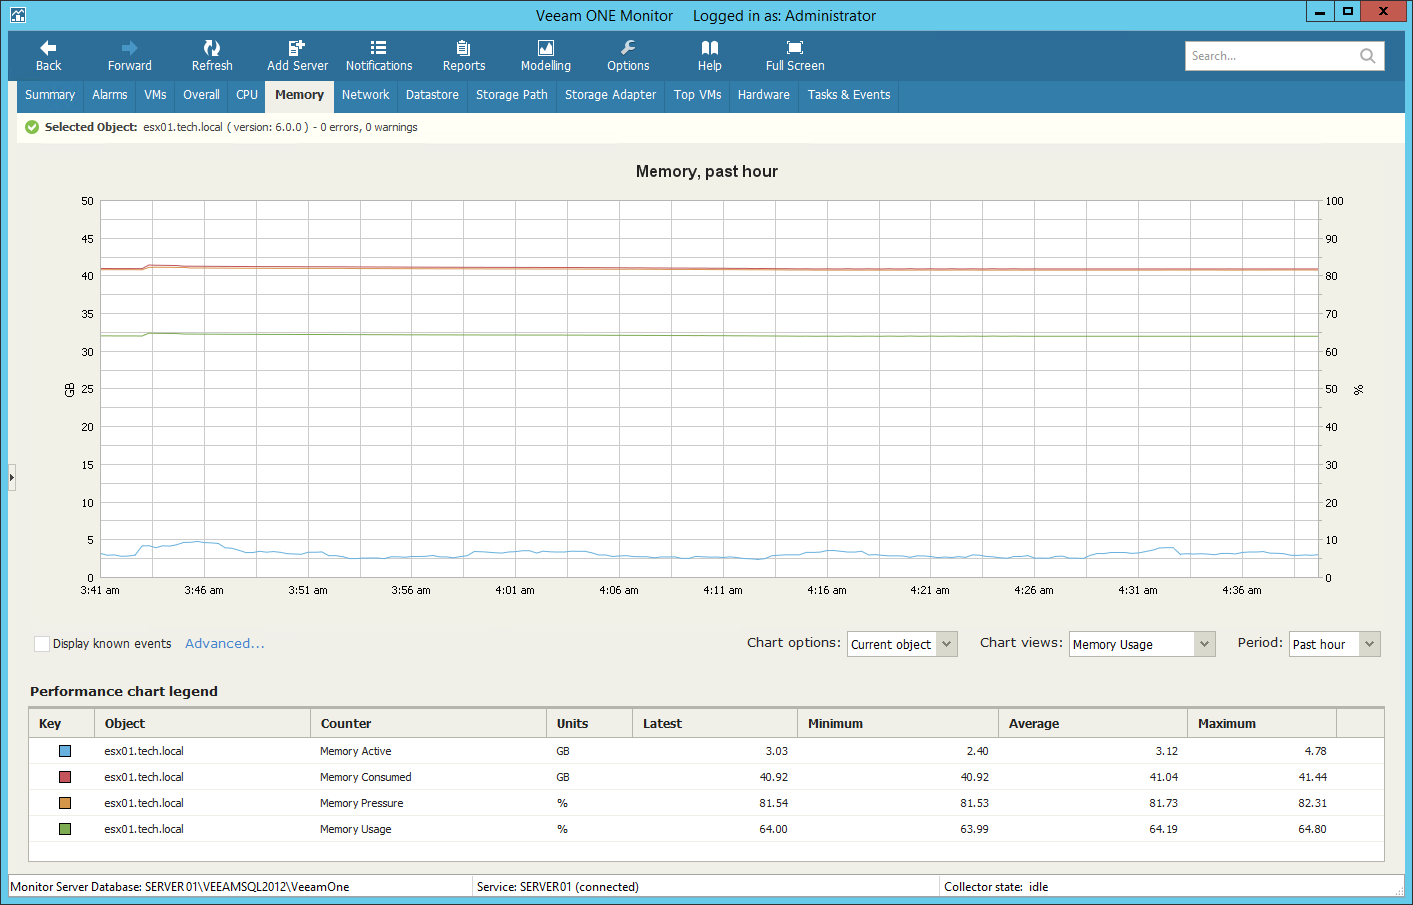
The Memory chart displays historical statistics on memory utilization for the selected virtual infrastructure object.
ESX(i) Host
The following table provides information on predefined views and counters that apply to hosts.
Chart View | Counter | Measurement Unit | Description |
Memory Usage | Memory Active | KB | Sum of all active memory metrics for all powered-on VMs plus vSphere services (such as COS, vpxa) on the host, as estimated by VMkernel based on recently touched memory pages. |
Memory Consumed | KB | Amount of physical memory used on the host, including memory used by the Service Console, VMkernel, vSphere services and total memory consumed by running VMs. | |
Memory Pressure | Percent | Potential memory demand that is based on total allocated memory for running VMs, memory overhead, effects of memory Transparent Page Sharing and total available memory. | |
Memory Usage | Percent | Memory usage as percentage of available machine memory. | |
Memory Swap Rate | Swap In Rate | KBps | Rate at which memory is swapped from disk into host active memory during the current interval. |
Swap Out Rate | KBps | Rate at which memory is swapped from host active memory to disk during the current interval. | |
Memory Swap Used | KB | Amount of physical memory currently swapped to disk: sum of memory swapped for all powered on VMs and vSphere services on the host. | |
Memory Management | Memory Balloon | KB | Amount of memory allocated by the virtual machine memory control driver (vmmemctl). |
Memory Compressed | KB | Amount of RAM pages memory compressed by host instead of swapping to disk. | |
Memory Overhead | KB | Total amount of memory overhead metrics for all powered-on VMs, plus memory overhead of running vSphere services on the host. | |
Memory Sharing | Memory Shared | KB | Sum of memory shared metrics for all powered-on VMs, plus memory consumed by vSphere services on the host. |
Memory Shared Common | KB | Total amount of memory shared by all powered-on VMs and vSphere services on the host. Subtract this metric from the memory shared metric to calculate how much memory is saved due to sharing. | |
Memory Latency | Memory Latency | Percent | Percentage of time a virtual machine is waiting to access swapped or compressed memory. |
Virtual Machine
The following table provides information on predefined views and counters that apply to virtual machines.
Chart View | Counter | Measurement Unit | Description |
Memory Usage | Memory Entitlement | KB | Amount of host physical memory the VM is entitled to, as determined by the ESX(i) scheduler. |
Memory Active | KB | Amount of guest “physical” memory actively used, as estimated by VMkernel based on recently touched memory pages. | |
Memory Consumed | KB | Amount of guest “physical” memory consumed by the VM. The value includes the shared and memory that might be reserved but not actually used; overhead memory is not taken into account. | |
Memory Usage | Percent | Memory usage as percentage of configured “physical” memory for the VM. | |
Memory Swap Rate | Swap In Rate | KBps | Rate at which memory is swapped from disk into active memory during the current interval. |
Swap Out Rate | KBps | Rate at which memory is swapped from active memory to disk during the current interval. | |
Memory Swapped | KB | Current amount of guest physical memory swapped out to the VM’s swap file by the VMkernel. The metrics refers to VMkernel swapping, not to guest OS swapping. | |
Memory Management | Memory Compressed | KB | Amount of RAM pages compressed by host instead of swapping to disk. |
Memory Overhead | KB | Amount of machine memory used by VMkernel to run the VM. | |
Memory Balloon | KB | Amount of memory allocated by the virtual machine memory control driver (vmmemctl). | |
Memory Sharing | Memory Saved by Zipping | KB | Amount of memory saved by memory zipping. |
Memory Shared | KB | Amount of guest “physical” memory that the VM shares with other virtual machines (through VMkernel Transparent Page Sharing and RAM deduplication). | |
Memory Latency | Memory Latency | Percent | Percentage of time a virtual machine is waiting to access swapped or compressed memory. |
For objects that are parent to ESX(i) hosts and VMs, Veeam ONE Monitor displays rollup values.
Charts for folders, clusters, datacenters, vCenter Servers display rollup values for all hosts in the container. Charts for resource pools display rollup values for all VMs in the resource pool.
