
You can launch performance charts for virtual infrastructure objects organized into business groups. You can view how objects in custom groups are performing, and identify if enough resources are allocated to these objects.
For Business View, Veeam ONE Monitor supports all dashboards that apply to categorized virtual infrastructure objects — VMs, hosts, clusters and datastores.
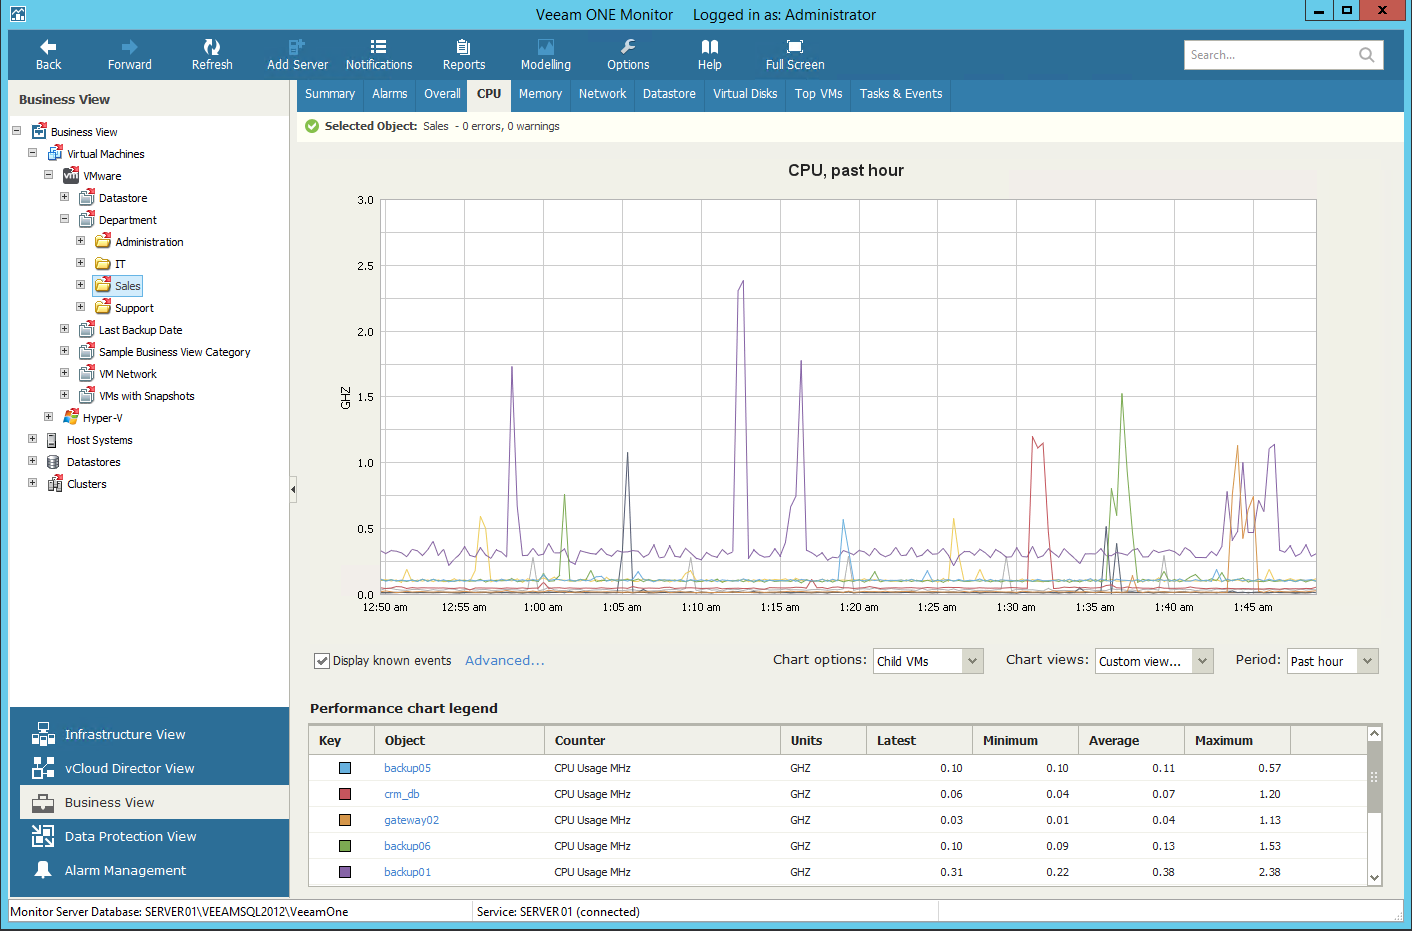
To access a performance chart for a categorized virtual infrastructure object:
- At the bottom of the inventory pane, click Business View.
- Select the necessary categorized object.
- Go to the necessary performance chart tab.
For more details on performance charts, see VMware Performance Charts and Hyper-V Performance Charts.
Send feedback | Updated on 3/3/2016
