
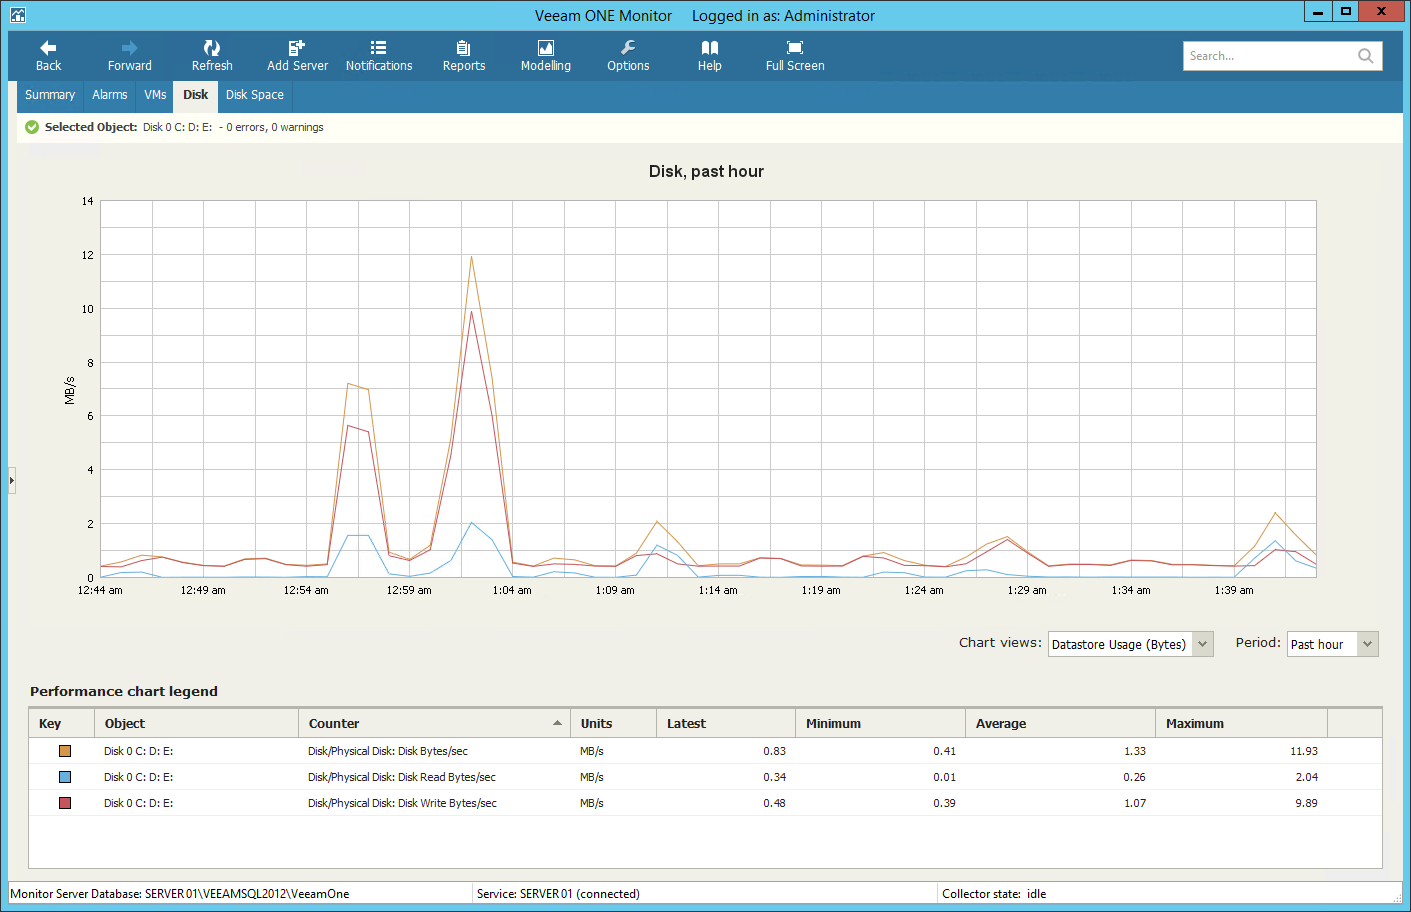
The Disk chart displays historical statistics on disk usage for the selected local volume.
The following table provides information on predefined views and counters.
Chart View | Counter | Measurement Unit | Description |
Datastore Usage (Bytes) | Disk/Physical Disk: Disk Read Bytes/sec | Bps | Rate at which bytes are transferred from the disk during read operations. |
Disk/Physical Disk: Disk Write Bytes/sec | Bps | Rate at which bytes are transferred from the disk during write operations. | |
Disk/Physical Disk: Disk Bytes/sec | Bps | Rate at which bytes are transferred and is the primary measure of disk throughput. To analyze transfer data based on reads and writes, use Disk Read Bytes/sec and Disk Write bytes/sec, respectively. | |
Datastore Queue Length | Disk/Physical Disk: Avg. Disk Queue Length | Number | Average number of both read and write requests that were queued for the selected disk during the sample interval. |
Datastore IOPS | Disk/Physical Disk: Disk Transfers/sec | Number | Number of reads and writes completed per second, regardless of how much data they involve. Measures disk utilization. If the value exceeds 50 (per physical disk in the case of a striped volume), then a bottleneck might be developing. To analyze transfer data based on reads and writes, use Disc Read/sec and Disk Write/sec, respectively. |
Datastore Latency | Disk/Physical Disk: Avg Disk sec/Read | Millisecond | Average time a read from the disk takes. |
Disk/Physical Disk: Avg Disk sec/Write | Millisecond | Average time a write to the disk takes. |
