
The Business View category summary dashboard provides an overview of the health state and performance for categorized virtual infrastructure objects.
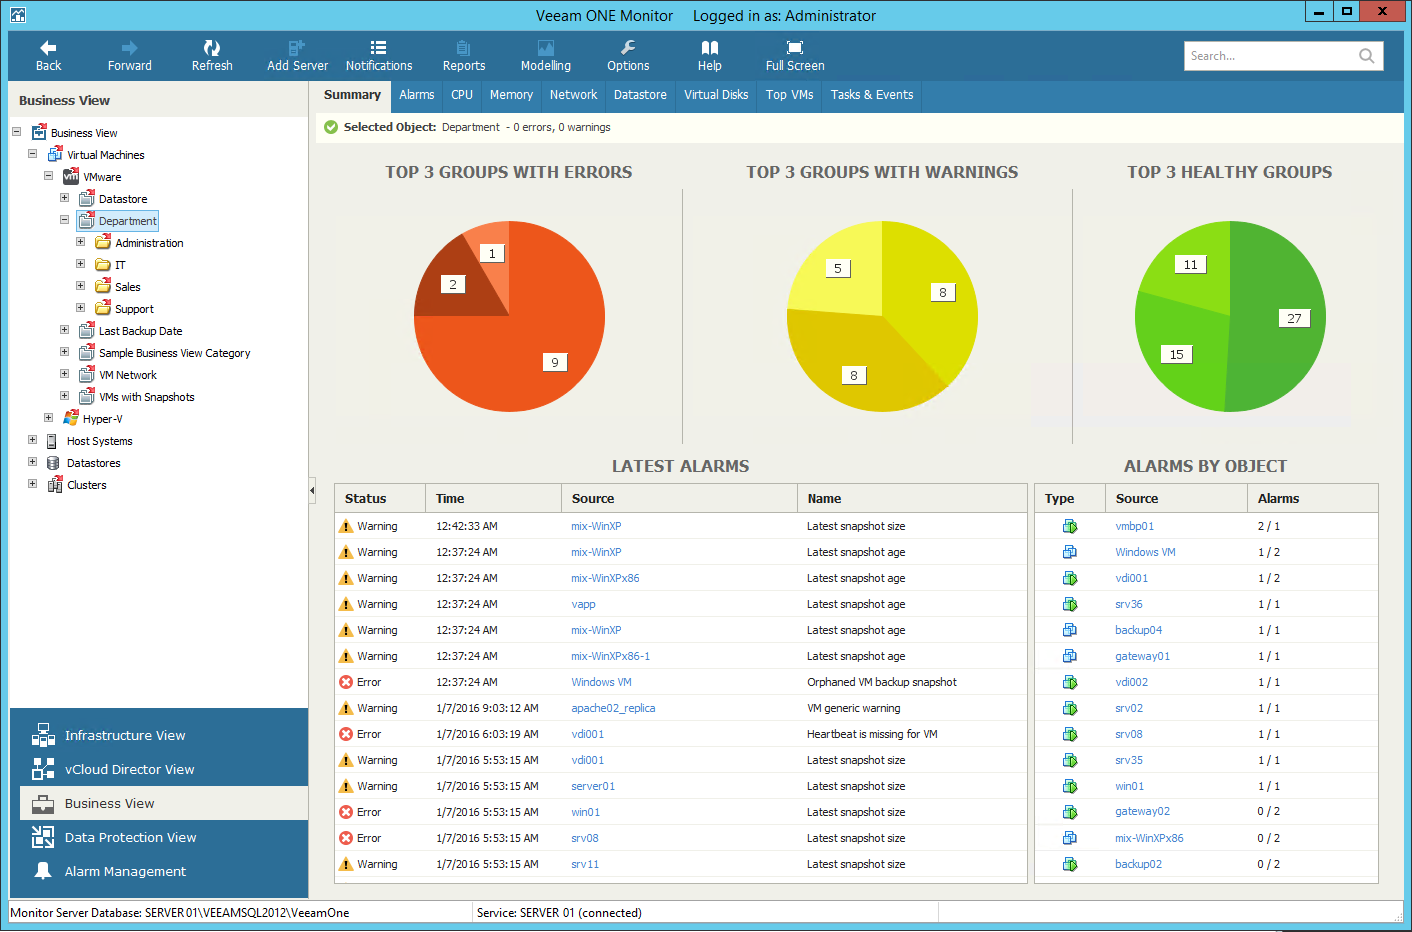
The Top 3 Groups with Errors, Top 3 Groups with Warnings and Top 3 Healthy Groups charts reflect the health state of all groups within the chosen category. Every chart segment represents 3 groups in a certain state — Green state groups include only healthy virtual infrastructure objects, Yellow state groups include the greatest number of virtual infrastructure objects with warnings, Red state groups include the greatest number of virtual infrastructure objects with errors. Click the problematic chart segment to drill-down to the list of alarms with the corresponding status for the selected Business View group.
The Latest Alarms list displays the latest 15 alarms for the selected category. Click the link in the Source column to drill-down to the list of alarms triggered for a specific virtual infrastructure object.
The Alarms by Object list displays 15 objects with the greatest number of alarms. The value in the Alarms column shows the number of errors and warnings for an object. For example, 3/1 means that there are 3 errors and 1 warning for the object. Click the link in the Source column to drill-down to the list of alarms triggered for a specific virtual infrastructure object.
For details on working with alarms, see the Veeam ONE Working with Alarms Guide.
