
The organization vDC summary dashboard presents resource utilization analysis and the health state overview for the chosen organization virtual datacenter.
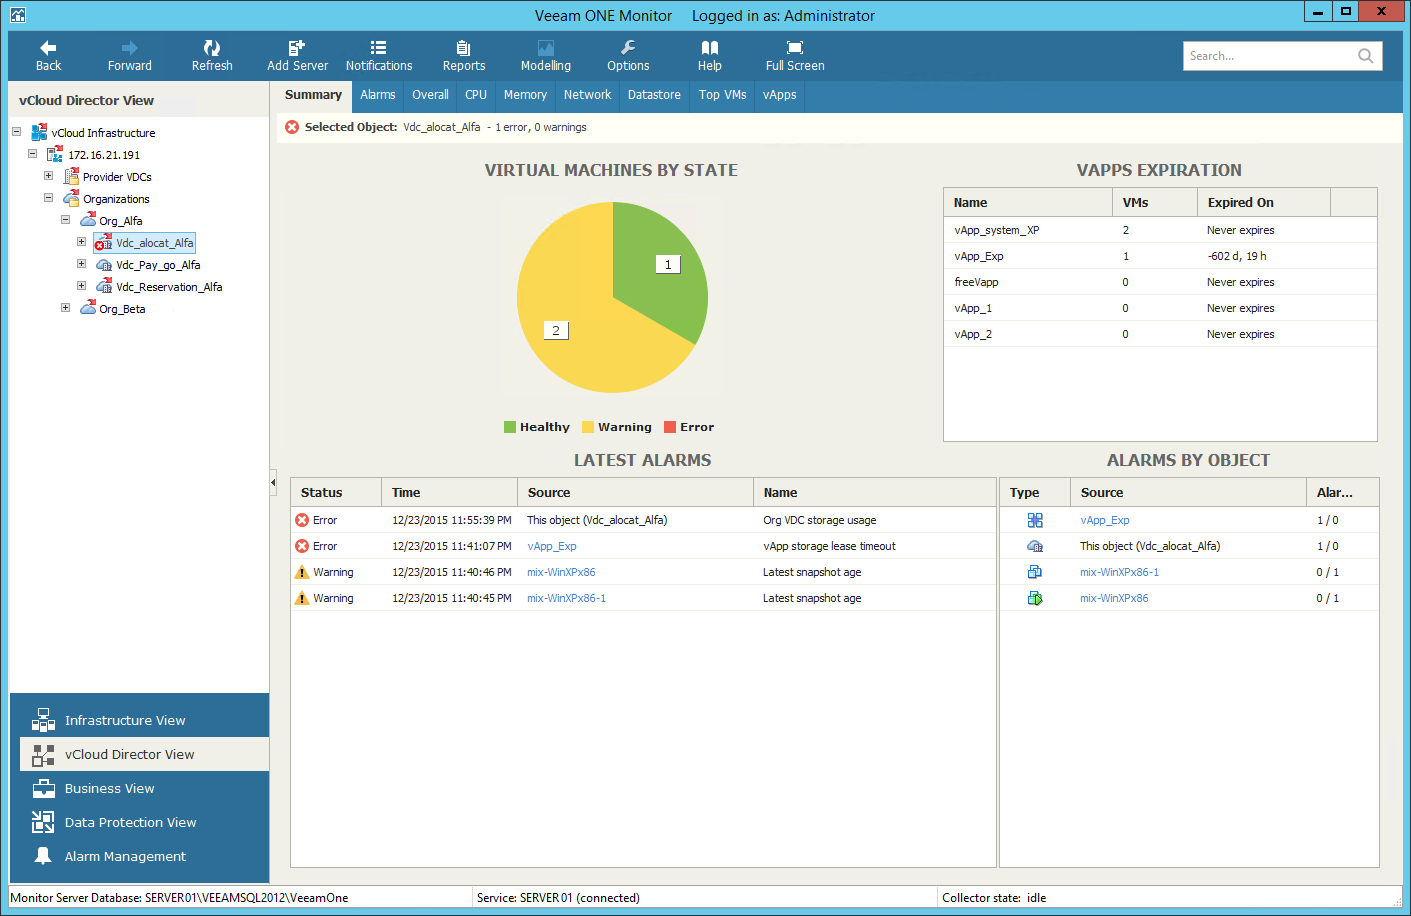
The Virtual Machines by State chart reflects the summary health state of VMs in the organization virtual datacenter. Every colored segment represents the number of VMs in a certain state — Green healthy VMs, Yellow VMs with warnings and Red VMs with errors. Click the chart to drill-down to the list of alarms triggered for VMs with the chosen health state.
The Expired vApps list displays vApps whose runtime lease or storage lease has expired. The list shows 15 items with the recently expired lease, and is only populated if the storage lease cleanup policy for the organization is set to Move to Expired Items.
The Latest Alarms list displays the latest 15 alarms for the organization vDC and its child objects (vApps and VMs). Click the link in the Source column to drill-down to the list of alarms triggered for a specific object.
The Alarms by Object list displays 15 objects with the greatest number of alarms. The value in the Alarms column shows the number of errors and warnings for an object. For example, 3/1 means that there are 3 errors and 1 warning for the object. Click the link in the Source column to drill-down to the list of alarms triggered for a specific object.
For details on working with alarms, see the Veeam ONE Working with Alarms Guide.
