
For VMware vSphere infrastructure objects, you can display resource-consuming events on performance charts:
- Live Migration (vMotion)
- Snapshot creation events
- Snapshot removal events
- Veeam Backup & Replication events
This option can help you detect events that caused performance degradation (for example, you can see what was the reason for a steep increase of the network resources usage).
To display events on a performance chart:
- At the bottom of the inventory pane, click Infrastructure View.
- Select the necessary infrastructure object.
- Go to the necessary performance chart tab.
- Select the Display known events check box at the bottom of the performance chart.
- To choose what type of events to show on the performance chart, click the Advanced link next to the Display known events check box and select the necessary events.
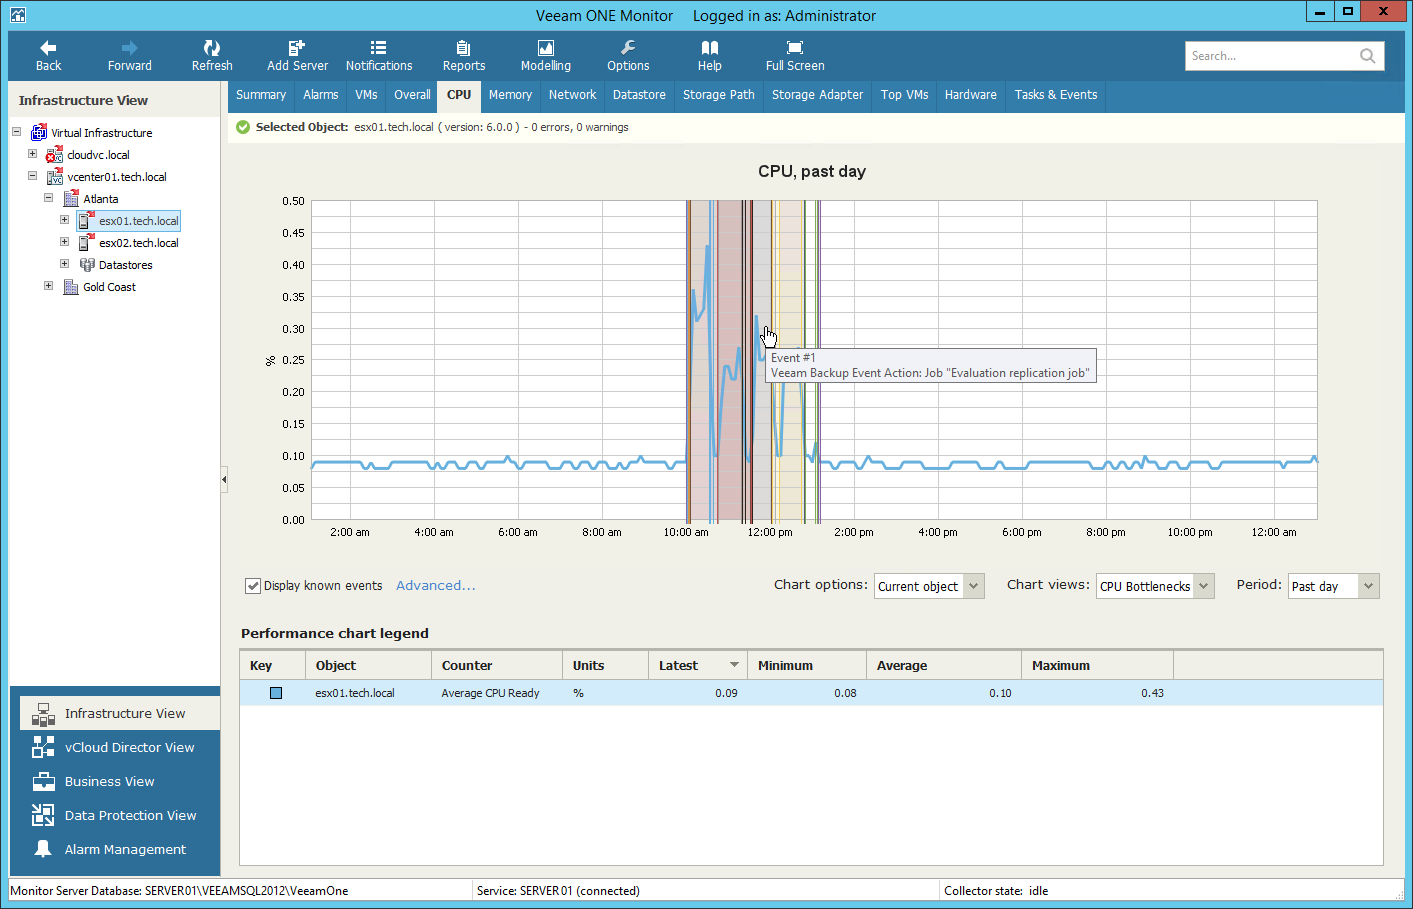
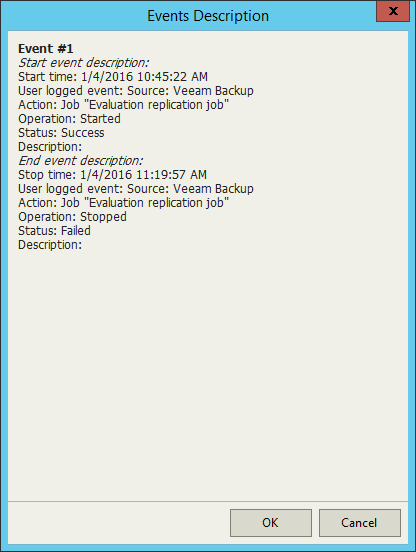
Events are shown as vertical lines crossing the performance graphs. To learn more about an event, hover the mouse cursor over it to see a tooltip, or click the line in the graph. The Events Description window will be opened.
|
The Display known events option is available only for time intervals not greater than 3 days. You will not be able to view events on the performance chart if a longer time interval is selected. |
Send feedback | Updated on 3/25/2016
