
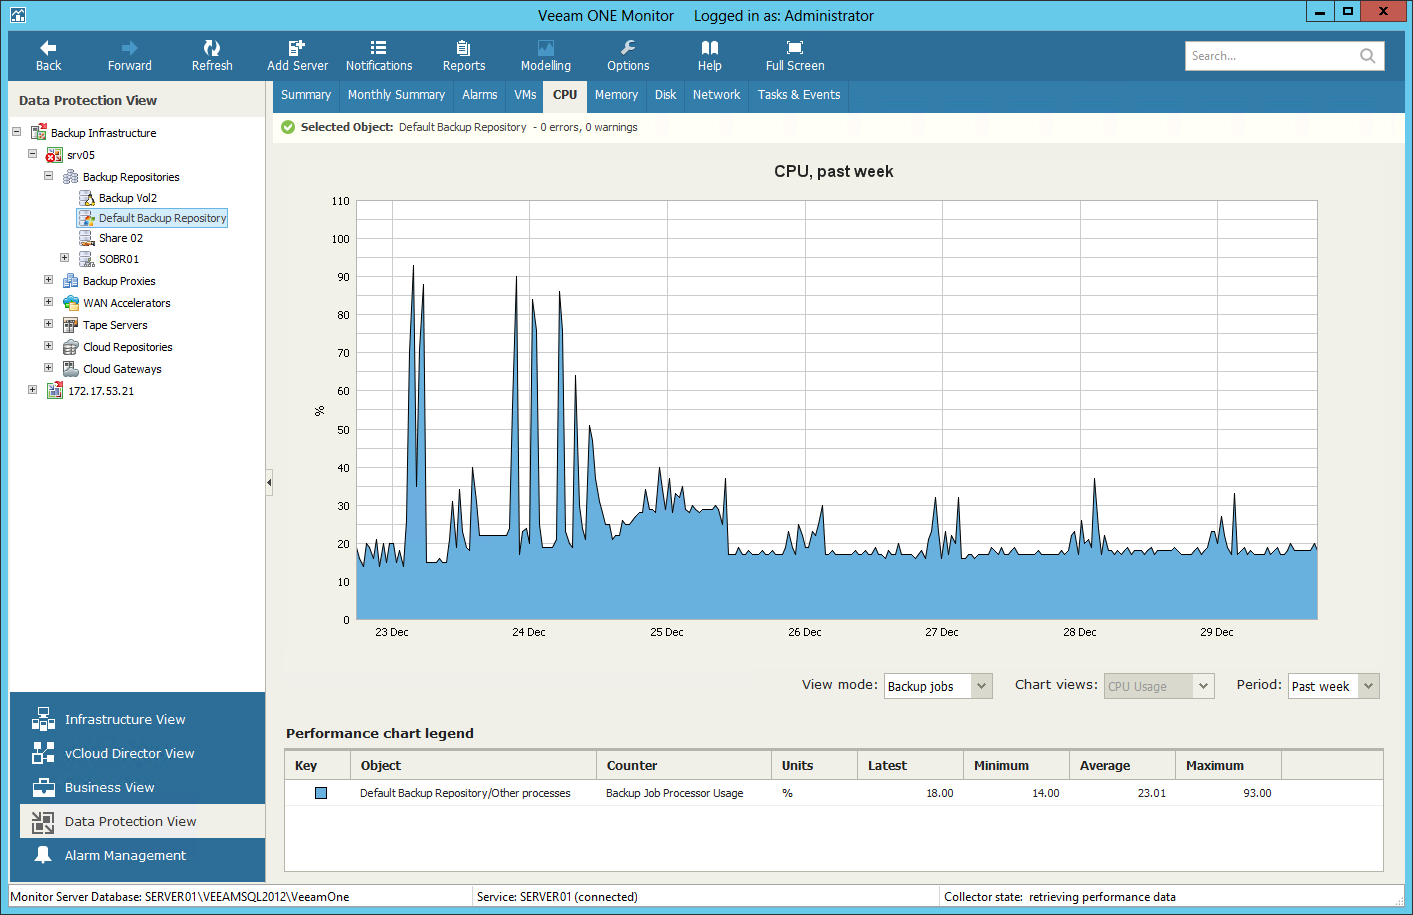
The CPU chart shows the amount of used processor resources on a machine where a backup infrastructure component runs. Graphs in the CPU chart illustrate the level of processor usage for every separate CPU on the machine. The Total graph shows the cumulative processor utilization for all CPUs.
By default, the chart shows the amount of processor time used to run all processes. To view what amount of CPU resources is consumed by each backup job, backup copy or replication job assigned to the selected backup infrastructure component, choose the Backup jobs option from the View mode list.
Send feedback | Updated on 3/3/2016
