
The summary dashboard for the Organizations node provides an overview for organizations under the selected vCloud Director cell.
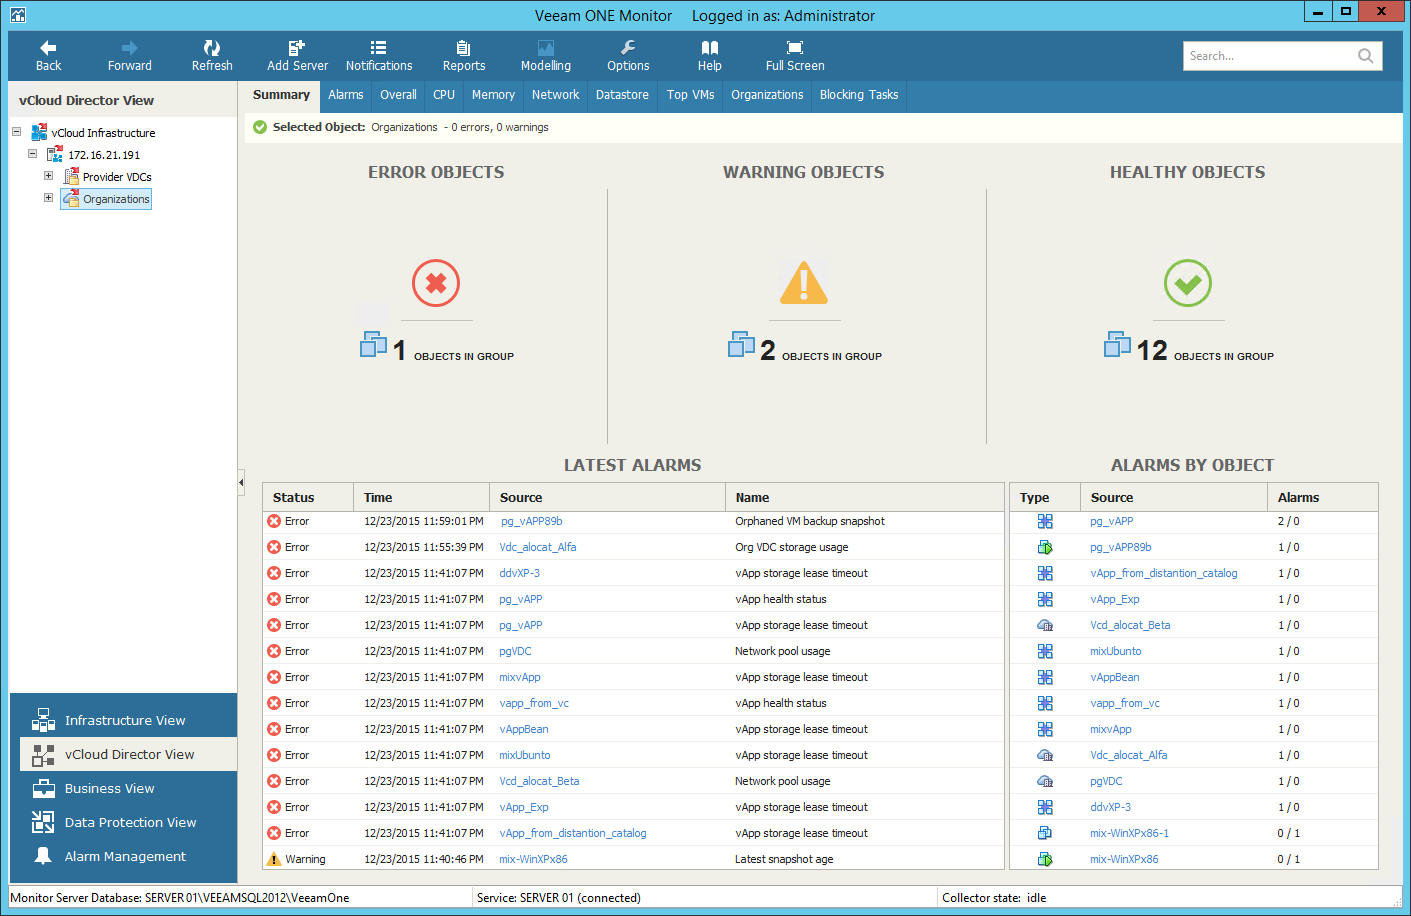
The Error Objects, Warning Objects and Healthy Objects charts group VMs in organizations by their health status. Every chart reflects the number of organization VMs with a specific state — Red VMs with errors, Yellow VMs with warnings and Green healthy VMs. Click the problematic chart to drill-down to the list of alarms for VMs with the chosen health state.
The Latest Alarms list displays the latest 15 alarms that were triggered for organizations, organization vDCs, as well as for VMs and vApps within these organizations. Click the link in the Source column to drill-down to the list of alarms triggered for a specific object.
The Alarms by Object list displays 15 objects with the greatest number of alarms. The value in the Alarms column shows the number of errors and warnings for an object. For example, 3/1 means that there are 3 errors and 1 warning for the object. Click the link in the Source column to drill-down to the list of alarms triggered for a specific object.
For details on working with alarms, see the Veeam ONE Working with Alarms Guide.
