
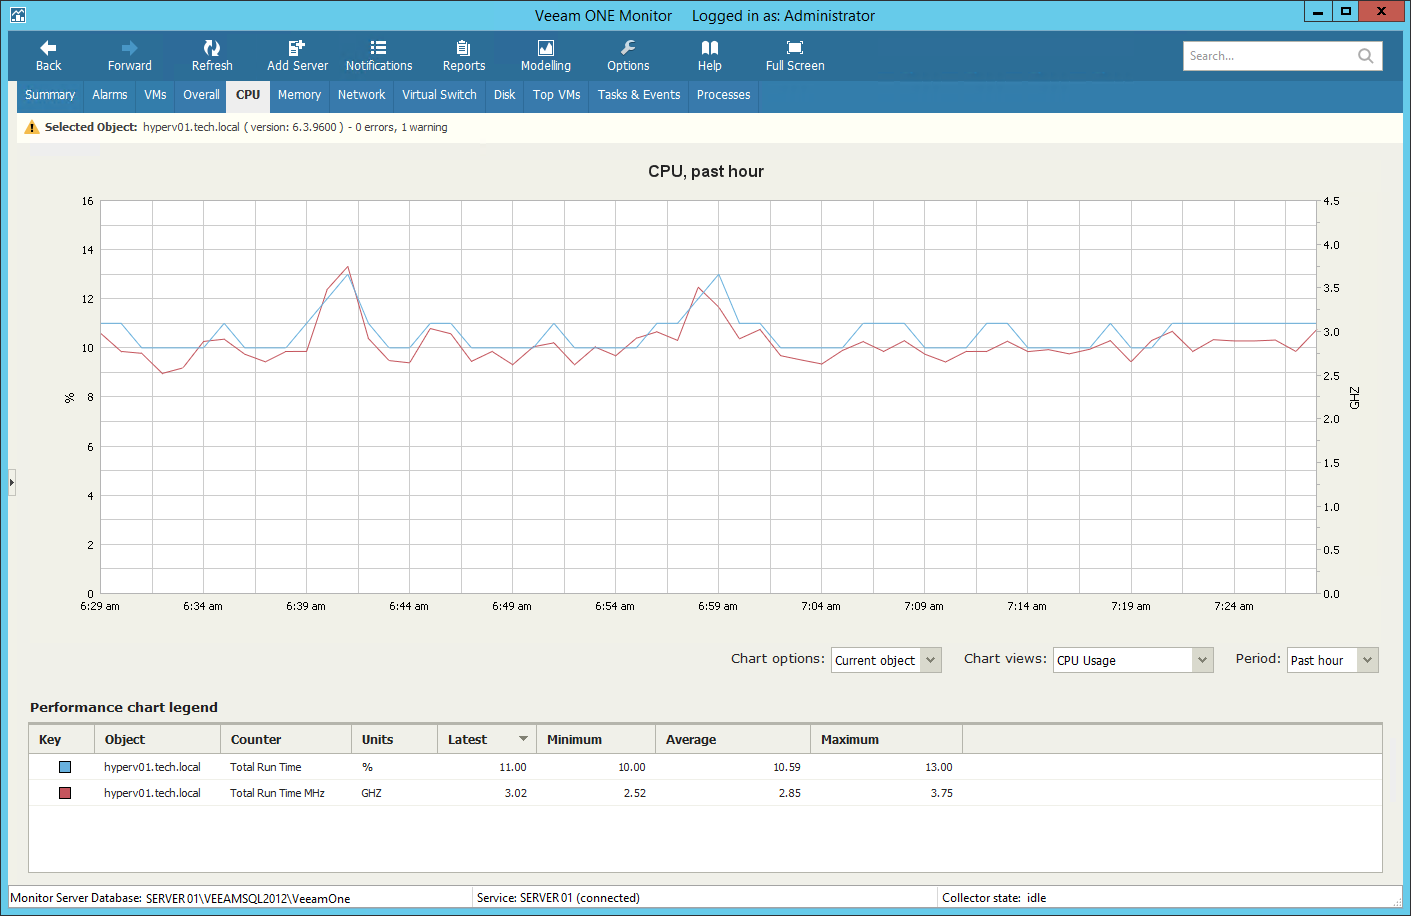
The CPU chart displays historical statistics on CPU utilization for the selected virtual infrastructure object.
Hyper-V Host
The following table provides information on predefined views and counters that apply to hosts.
Chart View | Counter | Measurement Unit | Description |
CPU Usage | Total Run Time | Percent | Percentage of physical processor time being used to run both VMs and the hypervisor itself. |
Total Run Time MHz | MHz | Amount of physical processor time being used to run both VMs and the hypervisor itself (in MHz). Note: By default, this counter is hidden in the CPU Usage view. To learn how to hide and show counters on performance charts, see Selecting Chart Views and Performance Counters. | |
CPU Usage by Host/VMs | Guest Run Time | Percent | Percentage of physical processor time being used to run VMs. |
Hypervisor Run Time | Percent | Percentage of physical processor time being used to run the hypervisor. | |
CPU Idle Time | Idle Time | Percent | Percentage of physical processor time spent in an idle state. |
CPU Interrupts | Total Interrupts/sec | Number | Number of interrupts to which the processor was asked to respond. Interrupts are generated from hardware components like hard disk controller adapters and network interface cards. A sustained value over 1000 is usually an indication of a problem. |
Virtual Machine
The following table provides information on predefined views and counters that apply to virtual machines.
Chart View | Counter | Measurement Unit | Description |
CPU Usage | Guest Run Time | Percent | Percentage of physical processor time being consumed by a VM. |
CPU Usage by Host | Hypervisor Run Time | Percent | Percentage of physical processor time consumed by Hyper-V host for a VM. |
Total Run Time | Percent | Percentage of physical processor time being consumed by the Hyper-V host to run the VM and by the VM itself. |
For objects that are parent to hosts and VMs, Veeam ONE Monitor displays rollup values.
Charts for folders and clusters display rollup values for all hosts in the container. Charts for resources display rollup values for all VMs registered as shared resources.
