
The Overall chart shows aggregated performance data for the selected virtual infrastructure object or segment: CPU, memory consumed, memory swap used, network and datastore usage. Performance data in the chart is shown for the previous 15 minutes.
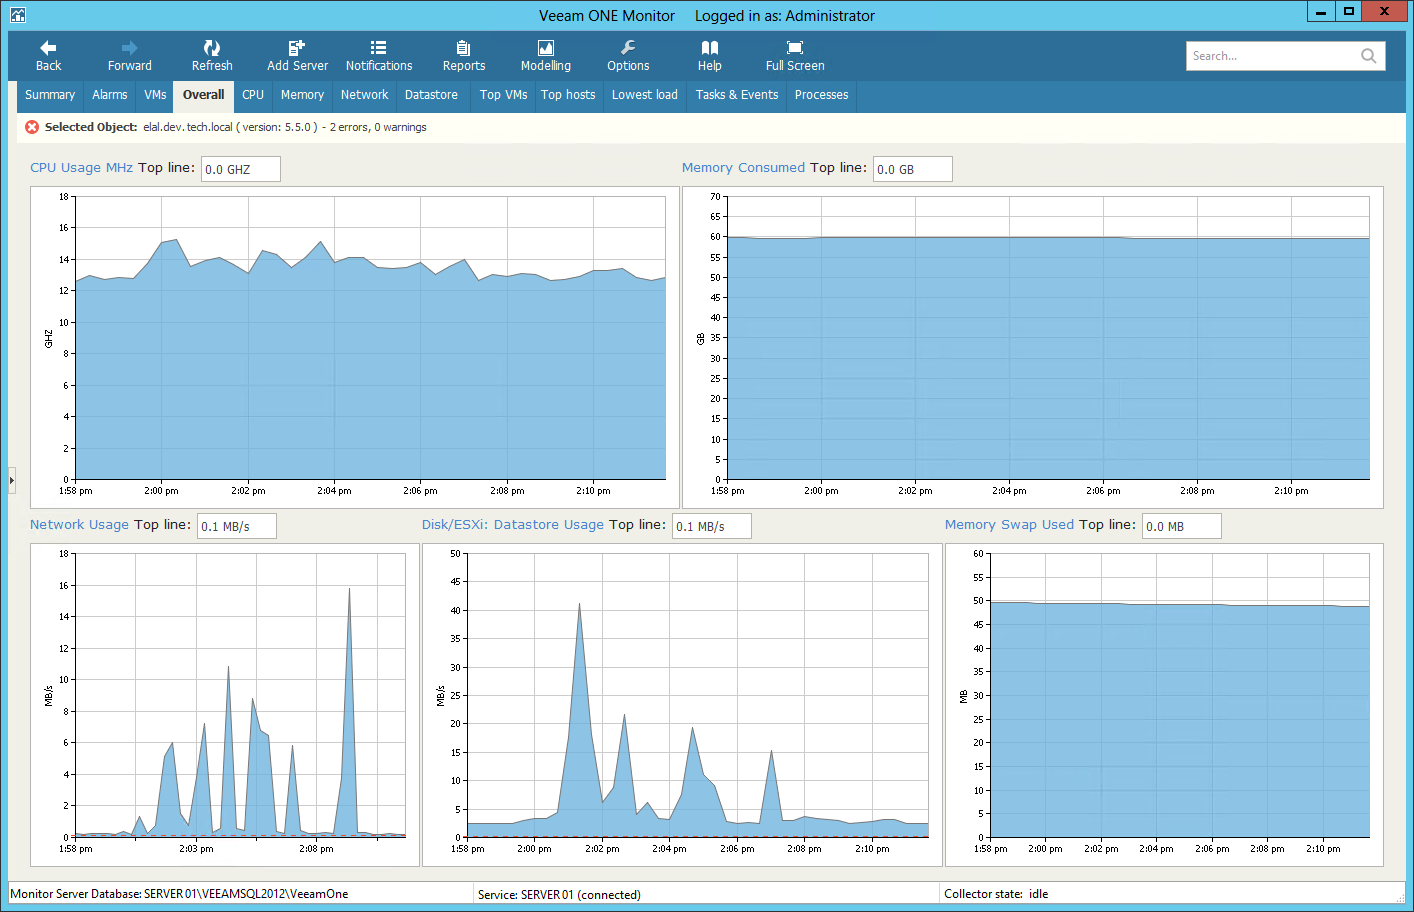
In the Top line field, you can set a threshold value. The top line is displayed as the red dotted line on the chart to help you monitor whether resource usage exceeds the healthy value range. If you do not need to display the top line, enter '0' (zero) in the Top line field or disable top lines in Veeam ONE Monitor chart settings. With the top line disabled, the Y-axis will scale automatically, to match the range of the displayed data.
To drill down to performance chart details, click the counter link above a performance widget. A corresponding performance chart for the selected virtual infrastructure object will be opened.
