
On the Chart tab, you can customize display preferences for graphs on performance charts. You can choose to show graphs in 2D or 3D, as plain lines or filled areas.
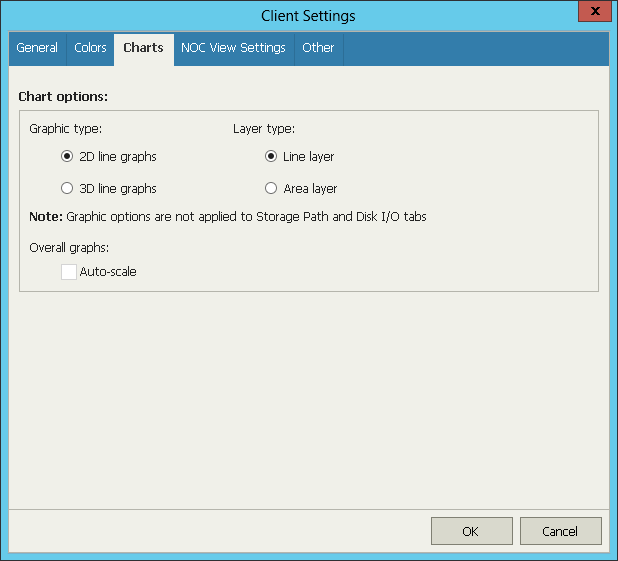
Graphic and Layer Type
The following images illustrate how different combinations of line graphs and layer types will be reflected on performance charts:
- 2D line graphs with line layer
- 3D line graphs with line layer
- 2D line graphs with area layer
- 3D line graphs with area layer
Auto-scale
The Auto-scale option allows you to enable auto-scaling if you want to remove top lines from performance charts on the Overall tab. With auto-scale enabled, the Y-axis scales automatically, to match the range of the displayed data.
- Auto-scale disabled
- Auto-scale enabled
Send feedback | Updated on 3/25/2016
