
The organization summary dashboard presents the health state overview for the chosen organization and its child objects.
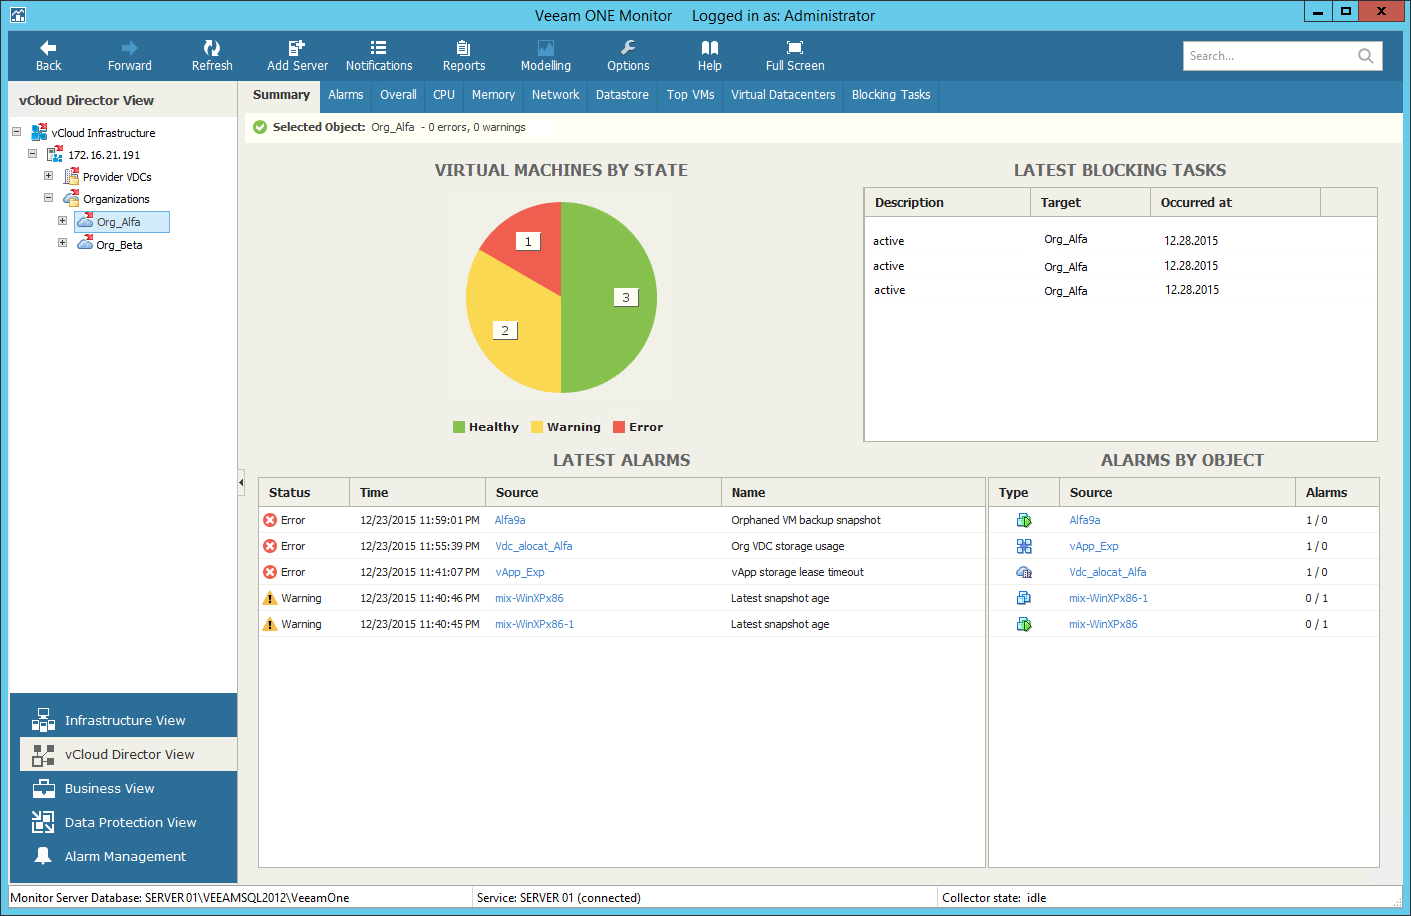
The Virtual Machines by State chart reflects the summary health state of VMs in the organization. Every colored segment represents the number of VMs in a certain state — Green healthy VMs, Yellow VMs with warnings and Red VMs with errors. Click the chart segment to drill-down to the list of alarms triggered for organization VMs with the chosen health state.
The Latest Blocking Tasks list displays the latest 15 suspended operations that require approval before the operation will resume. For each pending operation, Veeam ONE Monitor provides a description, the organization for which the operation was initiated and the time when the operation was initiated by an organization user. Blocking tasks that expired with timeout are not included in the list.
The Latest Alarms list displays the latest 15 alarms for the organizations, organization vDCs, as well as for VMs and vApps within these organizations. Click the link in the Source column to drill-down to the list of alarms triggered for a specific object.
The Alarms by Object list displays 15 objects with the greatest number of alarms. The value in the Alarms column shows the number of errors and warnings for an object. For example, 3/1 means that there are 3 errors and 1 warning for the object. Click the link in the Source column to drill-down to the list of alarms triggered for a specific object.
For details on working with alarms, see the Veeam ONE Working with Alarms Guide.
