
The cloud gateway summary dashboard provides overview information and performance analysis for the chosen gateway over the past day, week or month.
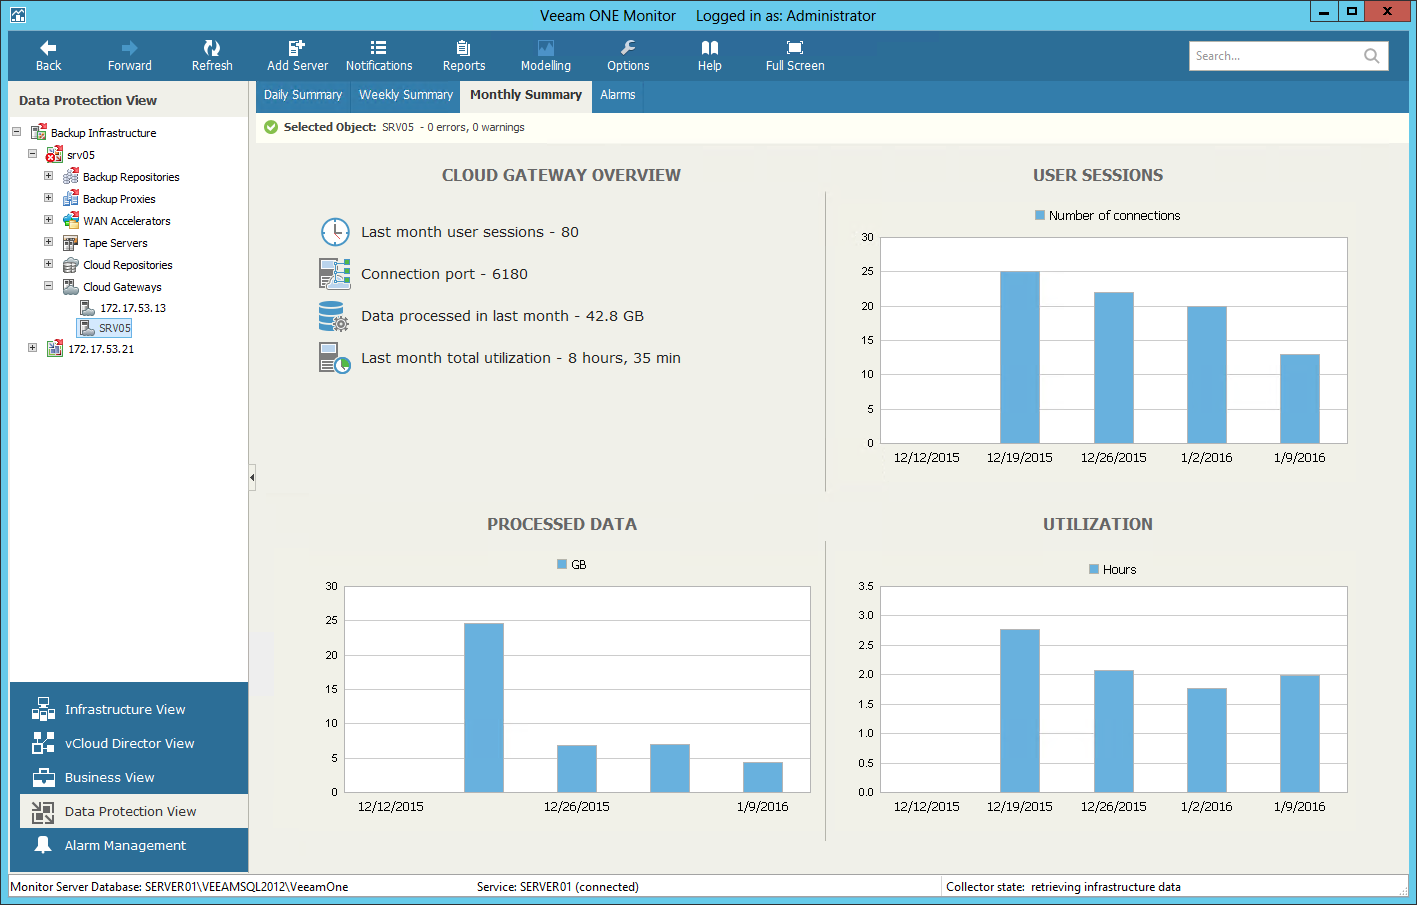
The Cloud Gateway Overview section outlines the following details:
- Number of users that have been connected to the gateway over the past day, week or month
- TCP/IP port configured for external connections on the cloud gateway
- The amount of backup data that the cloud gateway processed over the last 24 hours, 7 days or month
- The total amount of time that the cloud gateway was retrieving, processing and transferring data
The User Connections/Sessions chart shows how many times the connection to the cloud gateway was established to transfer backup traffic over the past period.
The Data Transferred/Processed Data chart shows the amount of backup data that the cloud gateway transferred to the cloud repository over the past period. The chart can help you measure the total amount of backup traffic coming through the cloud gateway.
The [Weekly/Monthly Summary] Utilization chart allows you to estimate how ‘busy’ the cloud gateway was during the past period. The chart shows the cumulative amount of time that the cloud gateway was retrieving, processing and transferring backup data. The chart can help you reveal possible resource bottlenecks. If the utilization graph on the chart is abnormally large, this can evidence of high CPU load or insufficient throughput.
