
The vCloud Director infrastructure summary dashboard provides the health state overview for all organizations and child vCloud Director objects in your environment.
The dashboard is available for the following infrastructure levels:
- vCloud Infrastructure (root node)
- vCloud Director cell presents an overview of the vCloud infrastructure
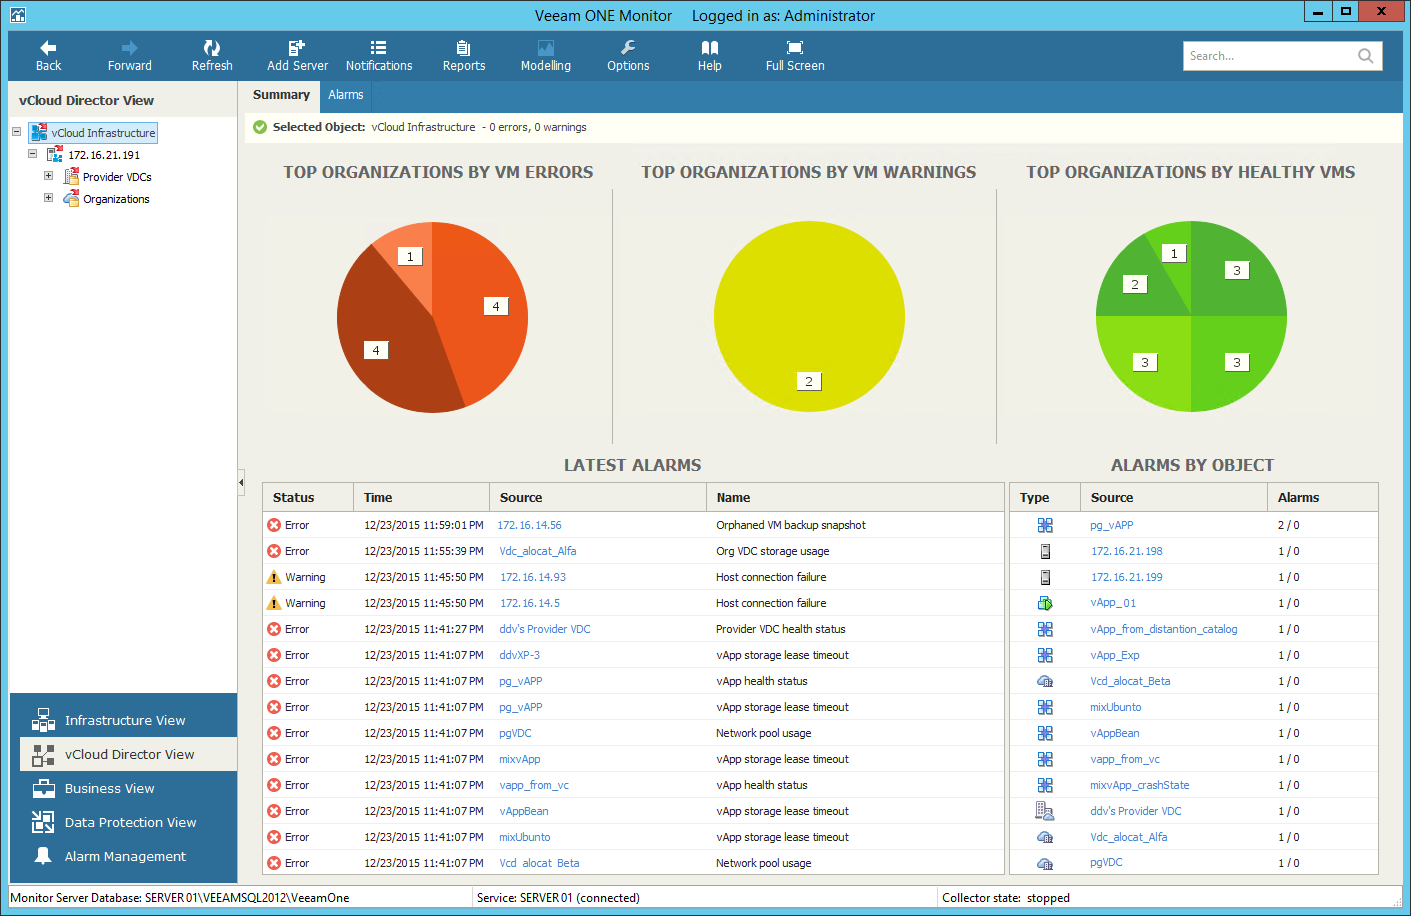
The Top 5 Organizations by VM Errors, Top 5 Organizations by VM Warnings and Top 5 Organizations by Healthy VMs chart segments represent organizations with the greatest number of errors, warnings and organizations with no registered alarms. Click a chart segment to drill-down to the list of alarms with the corresponding status for the selected organization.
The Latest Alarms list displays the latest 15 alarms for the selected vCloud Director segment. Click the link in the Source column to drill-down to the list of alarms triggered for a specific vCloud Director infrastructure object.
The Alarms by Object list displays 15 objects with the greatest number of alarms. The value in the Alarms column shows the number of errors and warnings for an object. For example, 3/1 means that there are 3 error alarms and 1 warning alarm for the object. Click the link in the Source column to drill-down to the list of alarms triggered for a specific vCloud Director infrastructure object.
