
The virtual machine summary dashboard provides the health state and performance overview for the selected VM. In addition, this dashboard shows the state of objects that can affect the VM performance — the parent host and the volumes where VM files are located.
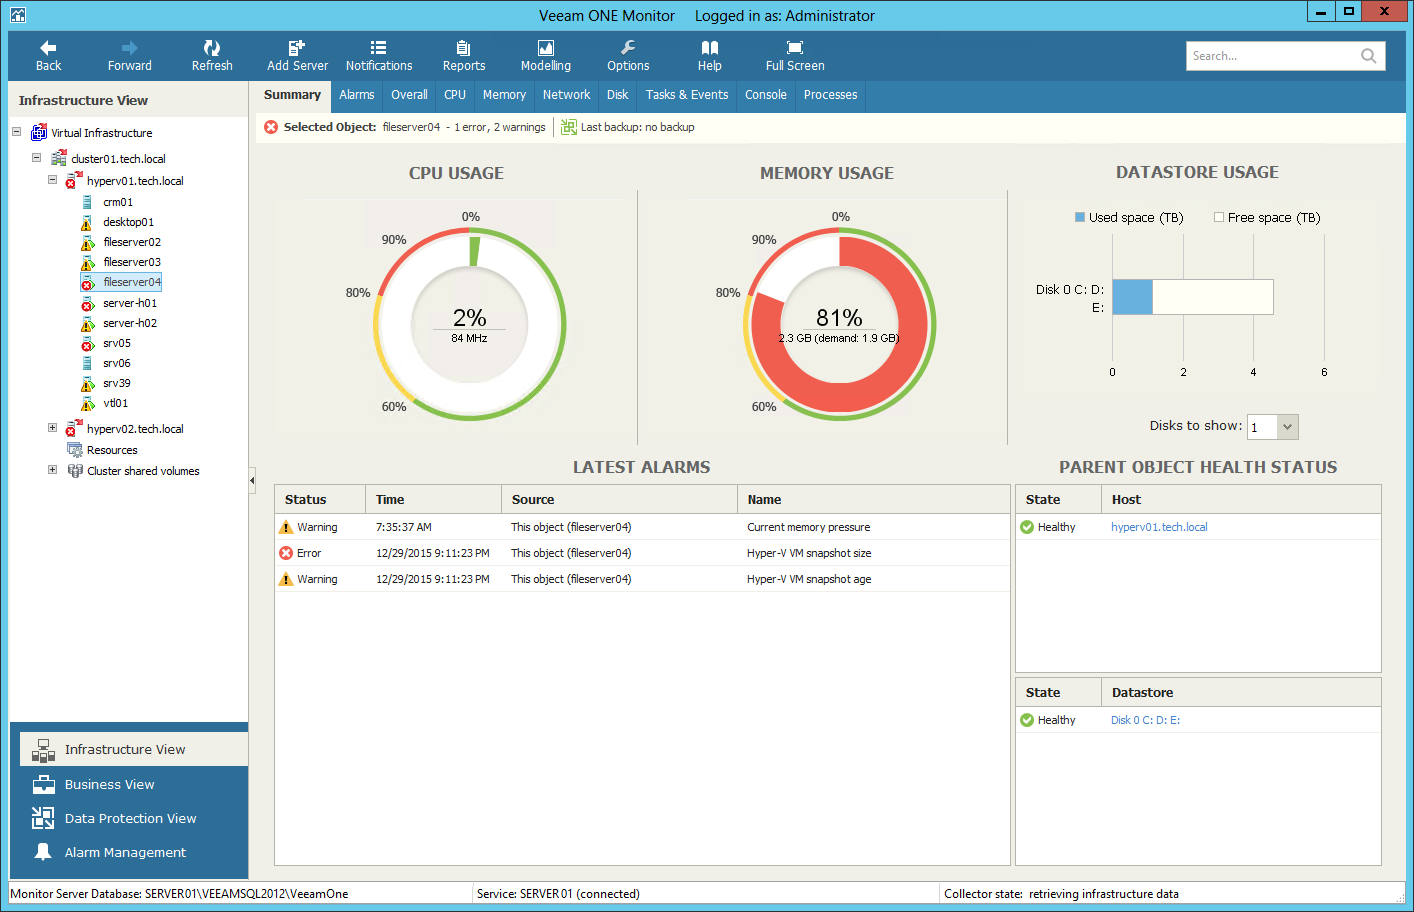
The Selected Object section at the top of the dashboard shows the VM health state (number of warnings and errors) and the date when the latest backup or replica restore point was created for the VM with Veeam Backup & Replication.
The CPU Usage and Memory Usage charts display the amount of CPU and memory resources that the VM is currently consuming.
|
Memory usage is displayed for VMs with Dynamic Memory. For VMs with Static Memory, memory usage is always shown as 100%. |
The Datastore Usage chart displays the amount of storage space available and consumed on the volume(s) where VM files reside. By default, the volume with the greatest amount of used space is displayed. Use the Disks to show list to change the number of volumes to display on the chart.
The Parent Object Health Status section displays the current state of the host where the VM resides and the state of volumes that host VMs files. Information in this section may help you to estimate the impact of parent objects on the VM performance. Click the host or volume name link to drill-down to the list of alarms for the host or volume.
The Latest Alarms list displays the latest 15 alarms for the VM.
For details on working with alarms, see the Veeam ONE Working with Alarms Guide.
