
The provider vDC summary dashboard reflects resource utilization analysis and the health state overview for the chosen provider virtual datacenter and vSphere resources.
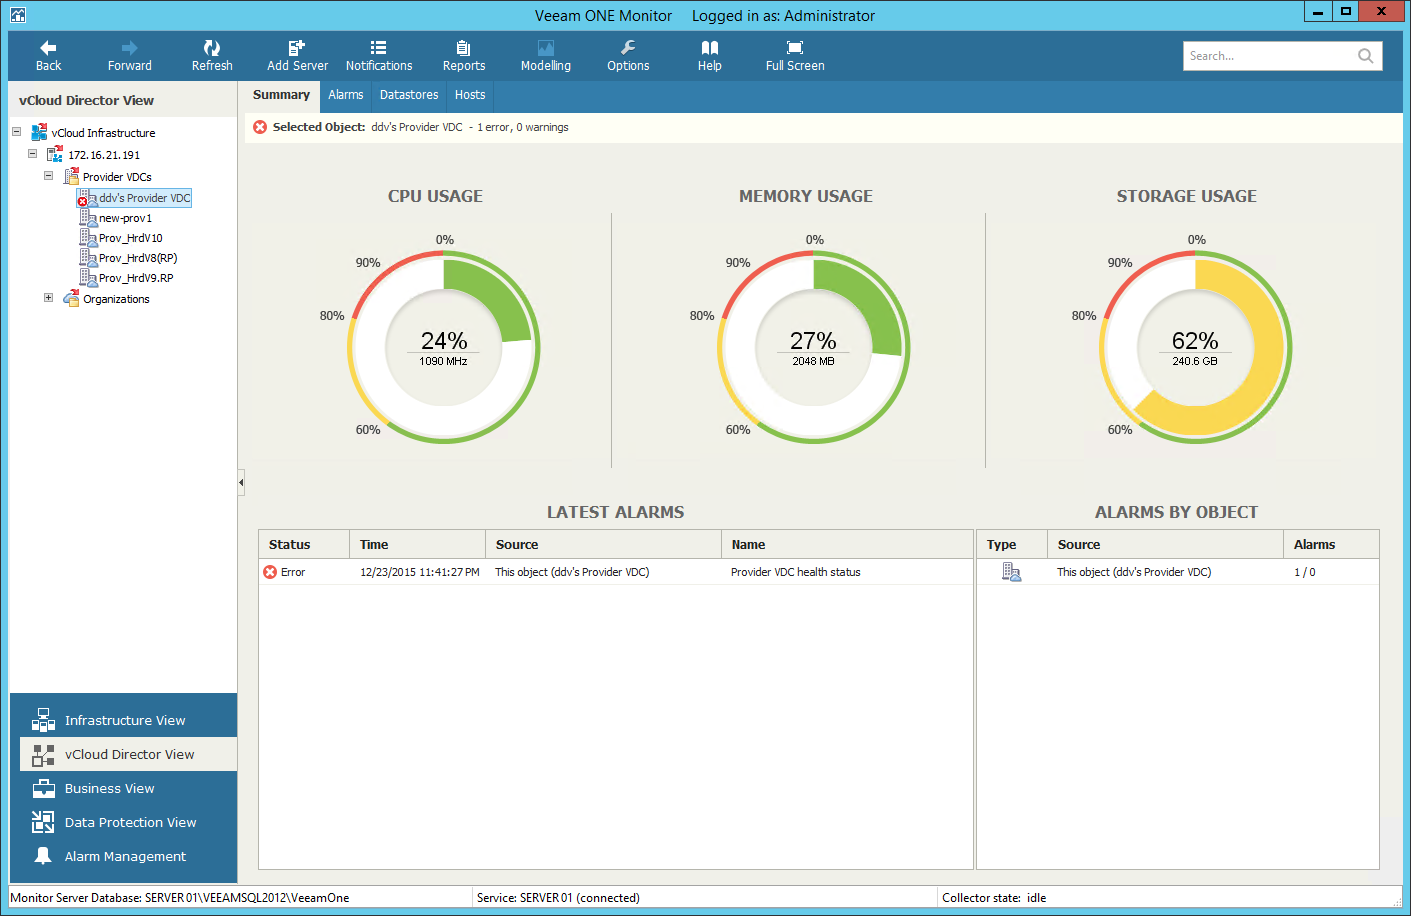
The CPU Usage, Memory Usage and Storage Usage charts reflect the amount of currently consumed CPU, memory and storage resources for the chosen provider virtual datacenter.
The Latest Alarms list displays the latest 15 alarms for the provider vDC and underlying virtual infrastructure objects (datastores and hosts). Click the link in the Source column to drill-down to the list of alarms triggered for a specific object.
The Alarms by Object section displays the current state of hosts and datastores that provide compute and storage resources for the provider vDC. Information in this section may help you to estimate the impact of underlying vSphere objects on the provider vDC and speed up root cause analysis. The value in the Alarms column shows the number of errors and warnings for an object. For example, 3/1 means that there are 3 error alarms and 1 warning alarm for the object. Click the link in the Source column to drill-down to the list of alarms triggered for a specific object.
For details on working with alarms, see the Veeam ONE Working with Alarms Guide.
