
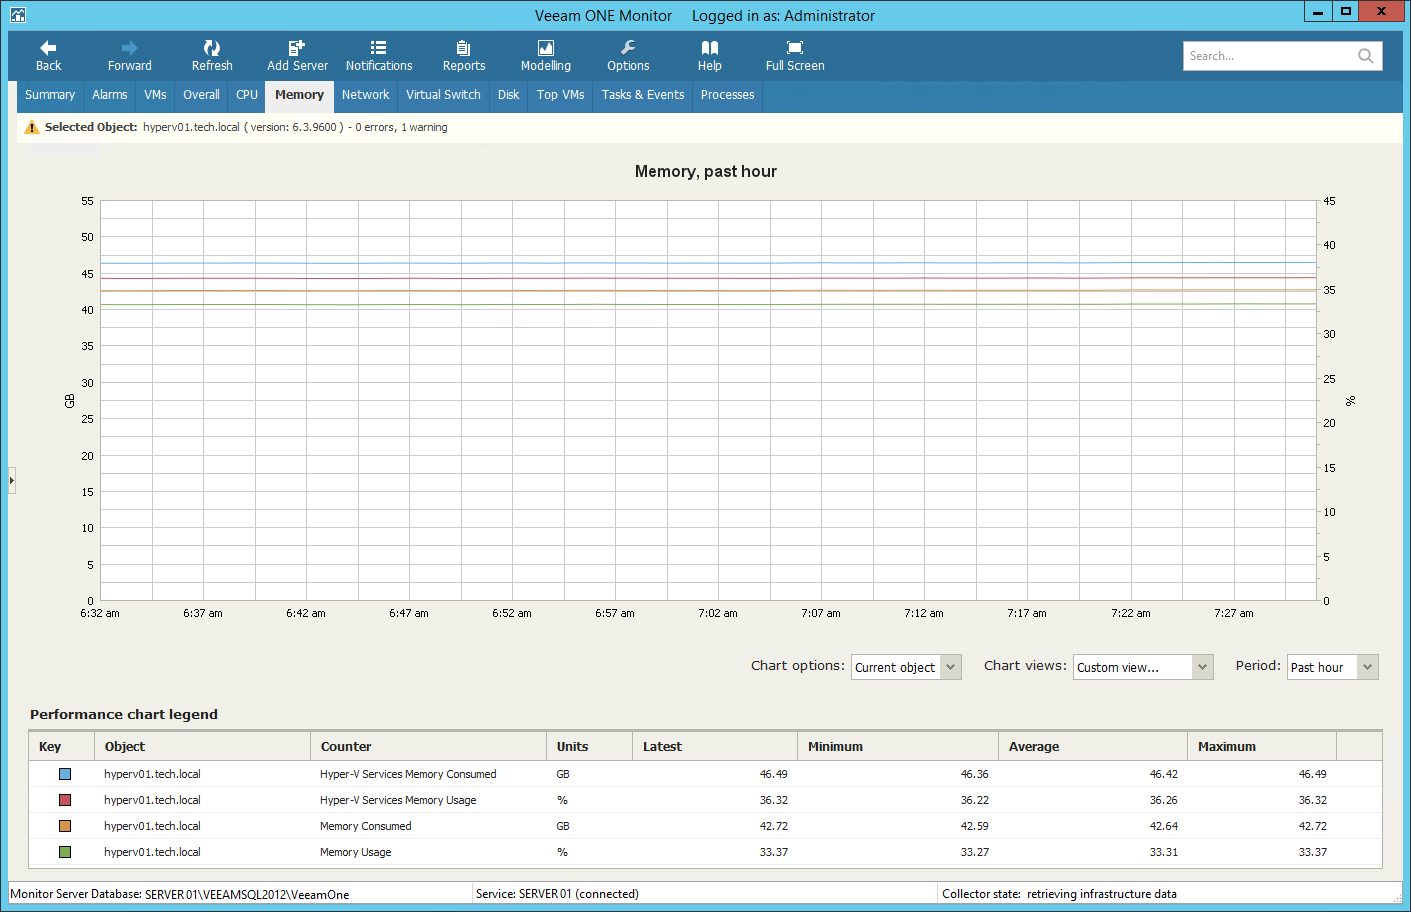
The Memory chart displays historical statistics on memory utilization for the selected virtual infrastructure object.
Hyper-V Host
The following table provides information on predefined views and counters that apply to hosts.
Chart View | Counter | Measurement Unit | Description |
Memory Usage | Hyper-V Services Memory Consumed | B | Current amount of memory consumed by Hyper-V services. |
Hyper-V Services Memory Usage | Percent | Current amount of memory used by Hyper-V services (measured in percent). | |
Memory Consumed | B | Amount of physical memory used on the host. | |
Memory Usage | Percent | Amount of physical memory used on the host (measured in percent). | |
Memory Pressure | Average Pressure | Percent | Memory availability on the host. |
Committed Memory | Committed Bytes | B | Demand for virtual memory. The conter shows how many bytes have been allocated by processes and to which the OS has committed a RAM page frame or a page slot in the pagefile (or both). As Committed Bytes grows above the available RAM, paging increases and the amount of the pagefile in use also increases. At some point, paging activity starts to significantly affect perceived performance. |
Memory Swap Faults | Page Faults/sec | Number | Page faults that occur when any process attempts to read from a virtual memory location that is marked as “not present.” Zero is the optimum measurement. The counter displays both hard page and soft page faults. Hard page faults occur when a file has to be retrieved from a hard disk rather than virtual memory. Soft page faults occur when a resolved page fault, found elsewhere in physical memory, interrupts the processor but have much less effect on performance. |
Memory Swap Rate | Page Reads/sec | Number | Memory shortage; the counter shows how often the system is reading from disk because of hard page faults. The counter shows the number of read operations, without regard to the number of pages retrieved in each operation. The counter is a primary indicator of the kinds of faults that cause system-wide delays. |
Page Writes/sec | Number | Number of times the disk was written to in an effort to clear unused items out of memory. Pages are written to disk only if they are changed while in physical memory, so they are likely to hold data, not code. The counter shows write operations, without regard to the number of pages written in each operation. | |
Pages Input/sec | Number | Rate at which memory pages are read from disk to resolve hard page faults. | |
Pages Output/sec | Number | Rate at which memory pages are written to disk. | |
Pages/sec | Number | Combination of Pages Input/sec and Pages Output/sec counters and is a general indicator of how often the system is using the hard drive to store or retrieve memory associated data. |
Virtual Machine
The following table provides information on predefined views and counters that apply to virtual machines.
Chart View | Counter | Measurement Unit | Description |
Memory Usage | Guest Visible Physical Memory | MB | Amount of memory that is visible to a guest OS running inside a VM. |
Physical Memory | MB | Current amount of memory in the VM. | |
Memory Pressure | Demand | B | Amount of memory the VM needs at the moment to meet the requirements of the active processes running in the VM. The amount represents the total committed memory based on data obtained from performance counters. |
Current Pressure | Percent | Current pressure in the VM. To calculate the counter, Microsoft Hyper-V looks at the total committed memory of the VM and then calculates pressure as the ratio of how much memory the VM wants to how much it has. |
For objects that are parent to hosts and VMs, Veeam ONE Monitor displays rollup values.
Charts for folders and clusters display rollup values for all hosts in the container. Charts for resources display rollup values for all VMs registered as shared resources.
