
The host summary dashboard provides the health state and performance overview for the selected ESX(i) host and its child objects.
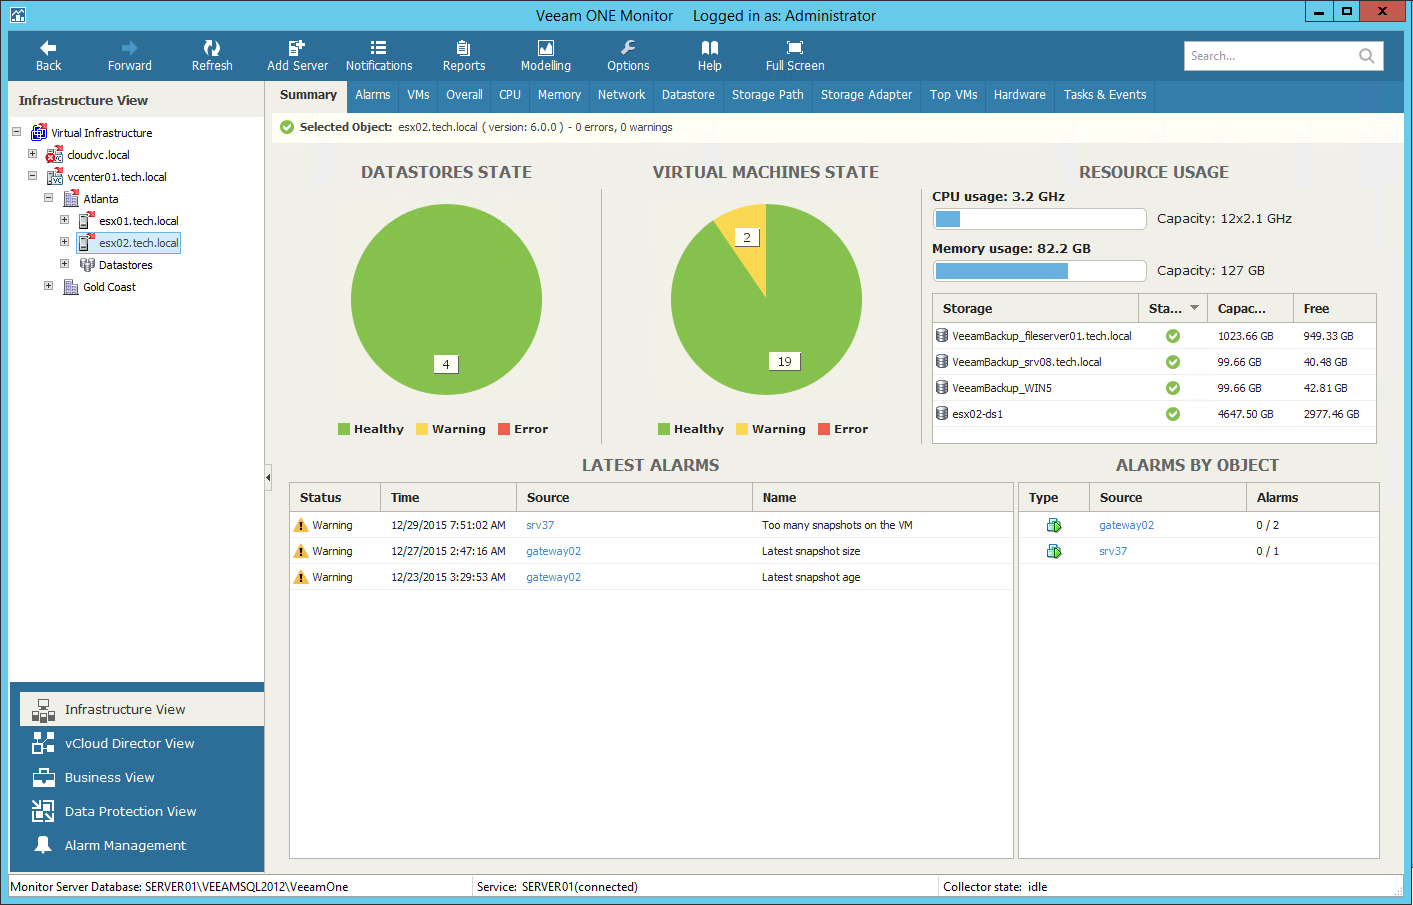
The Datastores State and Virtual Machines State charts reflect the state of datastores connected to the host and the state of VMs running on the host. Every chart segment represents the number of objects in a certain state — Green healthy objects, Yellow objects with warnings and Red objects with errors. Click a chart segment to drill-down to the list of alarms with the corresponding status for host child objects.
The Resource Usage section displays capacity and performance summary for host CPU and memory. It also shows an overview for datastores connected to the host — state of the datastore, its capacity and the amount of free space on the datastore.
The Latest Alarms list displays the latest 15 alarms triggered for the host and its child objects. Click the link in the Source column to drill-down to the list of alarms for the host and its child objects.
The Alarms by Object list displays 15 objects with the greatest number of alarms (including the host and its child objects). The value in the Alarms column shows the number of errors and warnings for an object. For example, 3/1 means that there are 3 error alarms and 1 warning alarm for the object. Click the link in the Source column to drill-down to the list of alarms triggered for the host and its child objects.
For details on working with alarms, see the Veeam ONE Working with Alarms Guide.
