
The CSV summary dashboard provides the health state and performance overview for the selected Cluster Shared Volume. In addition, it shows the state of objects that can affect the volume performance — hosts that work with the CSV and VMs residing on the CSV.
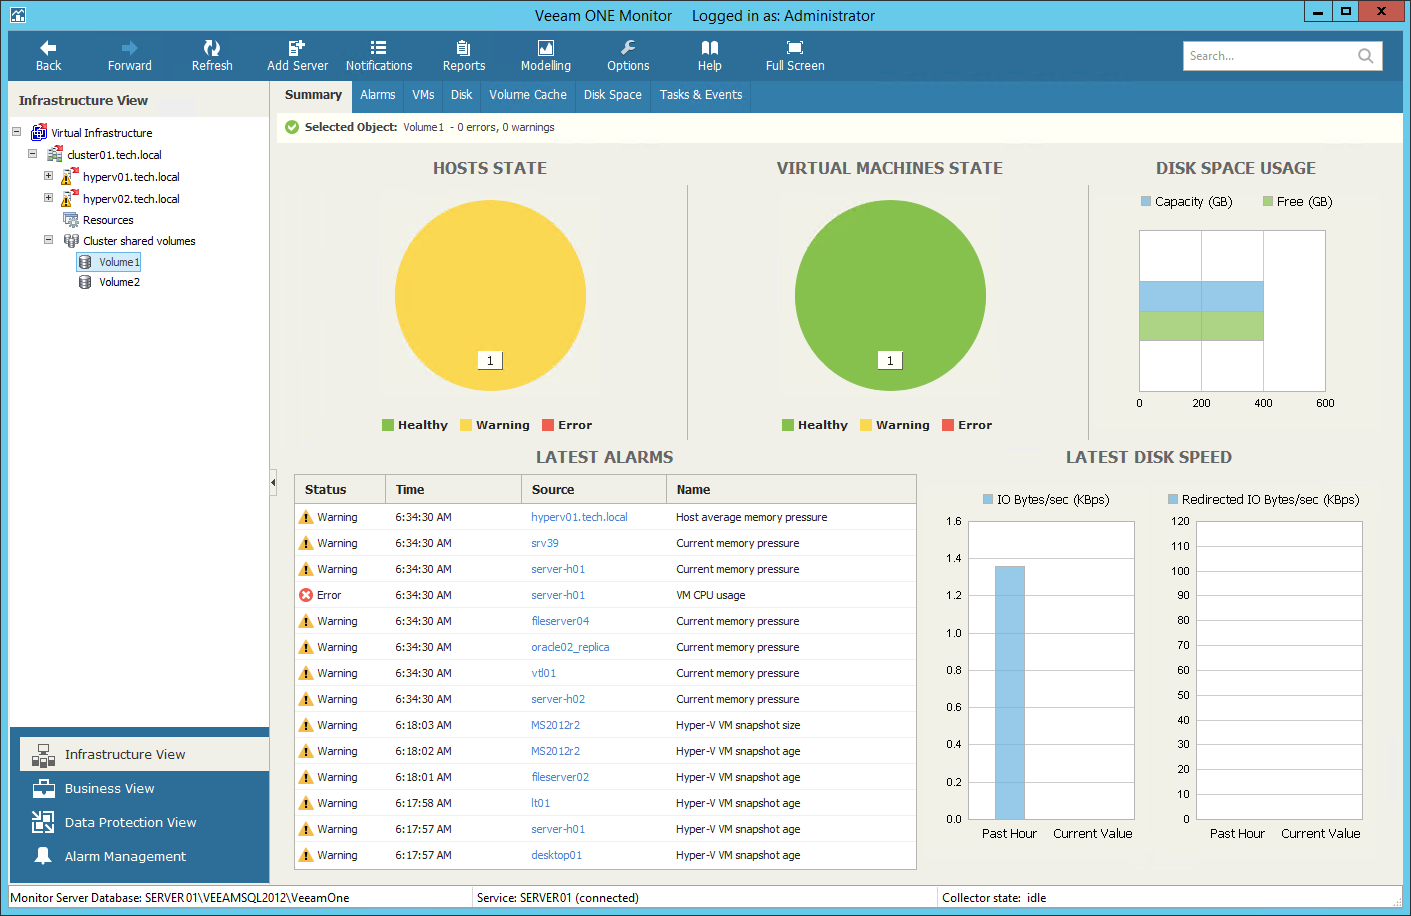
The Hosts State and Virtual Machines State charts reflect the health state of hosts that work with the volume and the state of VMs stored on the volume. Every colored segment represents the number of objects in a certain state — Green healthy objects, Yellow objects with warnings and Red objects with errors. Click a chart segment to drill-down to the list of alarms with the corresponding status for hosts or VMs.
The Disk Space Usage chart reflects the amount of available and used disk space on the Cluster Shared Volumes.
The Latest Disk Speed section displays the current direct and redirected I/O values as well as the average values for the past hour.
The Latest Alarms list displays the latest 15 alarms for the Cluster Shared Volumes and objects that work with the volumes. Click the link in the Source column to drill-down to the list of alarms for the selected object.
For details on working with alarms, see the Veeam ONE Working with Alarms Guide.
