
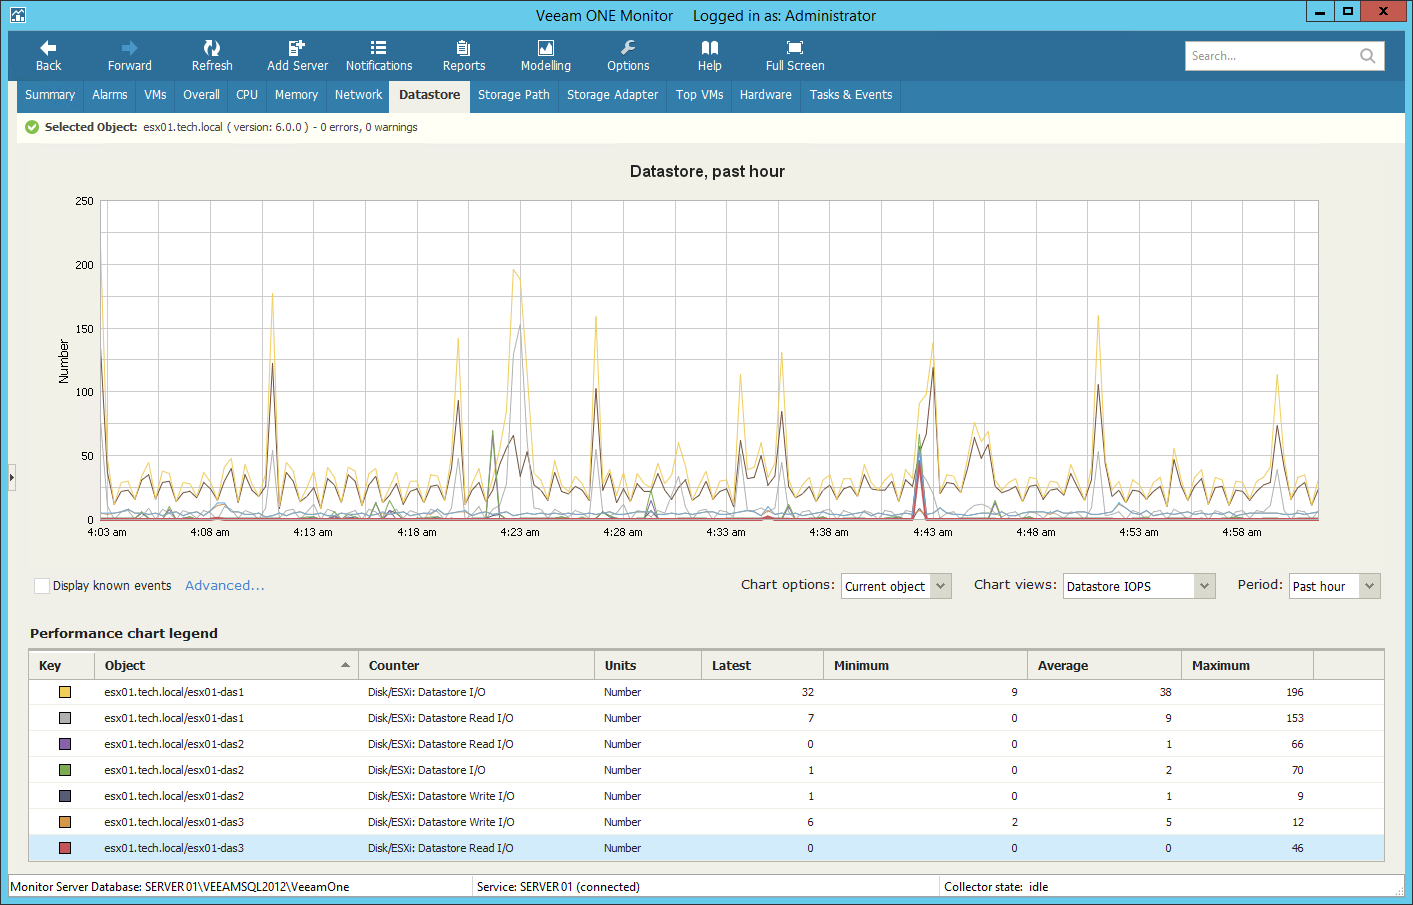
The Datastore chart displays historical statistics for all datastores (including vSAN datastores) used by the selected infrastructure component and its child objects.
ESX(i) Host
The following table provides information on predefined views and counters that apply to hosts.
Chart View | Counter | Measurement Unit | Description |
Datastore IOPS | Disk/ESXi: Datastore I/O | Number | Aggregate number of I/O operations on the datastore. |
Disk/ESXi: Datastore Read I/O | Number | Average number of read commands per second to the datastore. | |
Disk/ESXi: Datastore Write I/O | Number | Average number of write commands per second to the datastore. | |
Datastore Usage Rates | Disk/ESXi: Datastore Read Rate | KBps | Rate at which data is read from the datastore. |
Disk/ESXi: Datastore Write Rate | KBps | Rate at which data is written to the datastore. | |
Disk/ESXi: Datastore Usage | KBps | Sum of read and write rates to the datastore. | |
Datastore Latency | Disk/ESXi: Datastore Read Latency | Millisecond | Average amount of time that a read from the datastore takes. |
Disk/ESXi: Datastore Write Latency | Millisecond | Average amount of time that a write to the datastore takes. | |
Disk/ESXi: Datastore Highest Latency | Millisecond | Highest latency value across all datastores used by the host. | |
Disk/ESXi: Datastore Latency Observed by VMs | Number | The average datastore latency as seen by virtual machines. | |
Datastore Issues | Disk/ESXi: Datastore Command Aborts | Number | Number of aborted SCSI commands. |
Disk/ESXi: Datastore Bus Resets | Number | Number of SCSI bus reset commands. | |
Disk/ESXi: Datastore Maximum Queue Depth | Number | Number of outstanding requests to the storage device. |
Virtual Machine
The following table provides information on predefined views and counters that apply to virtual machines.
Chart View | Counter | Measurement Unit | Description |
Datastore IOPS | Datastore I/O | Number | Aggregate number of I/O operations on the datastore. |
Datastore Read I/O | Number | Average number of read commands per second to the datastore. | |
Datastore Write I/O | Number | Average number of write commands per second to the datastore. | |
Disk/vSAN: Recovery Write I/O | Number | Average number of write commands per second to the disk of the vSAN datastore that contains copy of VM data. | |
Datastore Usage Rates | Datastore Read Rate | KBps | Rate at which data is read from the datastore. |
Datastore Write Rate | KBps | Rate at which data is written to the datastore. | |
Datastore Usage | KBps | Sum of read and write rates to the datastore. | |
Disk/vSAN: Recovery Write Rate | KBps | Rate of writing data to the vSAN datastore disk storing copy of VM data takes. | |
Datastore Latency | Datastore Read Latency | Millisecond | Average amount of time that a read from the datastore takes. |
Datastore Write Latency | Millisecond | Average amount of time that a write to the datastore takes. | |
Datastore Highest Latency | Millisecond | Highest latency value across all datastores used by the host. | |
Disk/vSAN: Recovery Write Latency | Millisecond | The average time a write operation to the vSAN datastore disk storing copy of VM data takes. | |
Datastore Issues | Datastore Command Aborts | Number | Number of aborted SCSI commands. |
Datastore Bus Resets | Number | Number of SCSI bus reset commands. |
For objects that are parent to ESX(i) hosts and VMs, Veeam ONE Monitor displays rollup values.
Charts for folders, clusters, datacenters, vCenter Servers display rollup values for all hosts in the container. Charts for resource pools display rollup values for all VMs in the resource pool.
