
You can choose the time interval for which performance data on the chart will be displayed. Available options are:
- Past hour (real-time information)
- Past day
- Past week
- Past month
- Past year
- Custom time range (you can choose any time interval within the specified number of hours, days, or weeks, or specify any from/to period)
To specify a time interval for which performance data should be displayed:
- At the bottom of the inventory pane, click Infrastructure View.
- Select the necessary virtual infrastructure object.
- Go to the necessary performance chart tab.
- From the Period list, select Past hour, Past day, Past week, Past month or Past year.
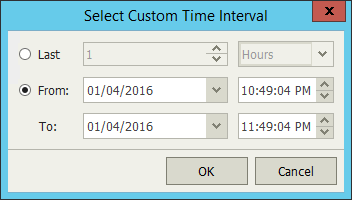
To define a custom time range, select Custom. In the Select Custom Time Interval window, define the necessary interval and click OK.
Once you change the time interval, the time scale (X-axis) of the performance chart and the chart will change respectively.
Send feedback | Updated on 3/25/2016
