This is an archive version of the document. To get the most up-to-date information, see the current version.
Reviewing Dashboard
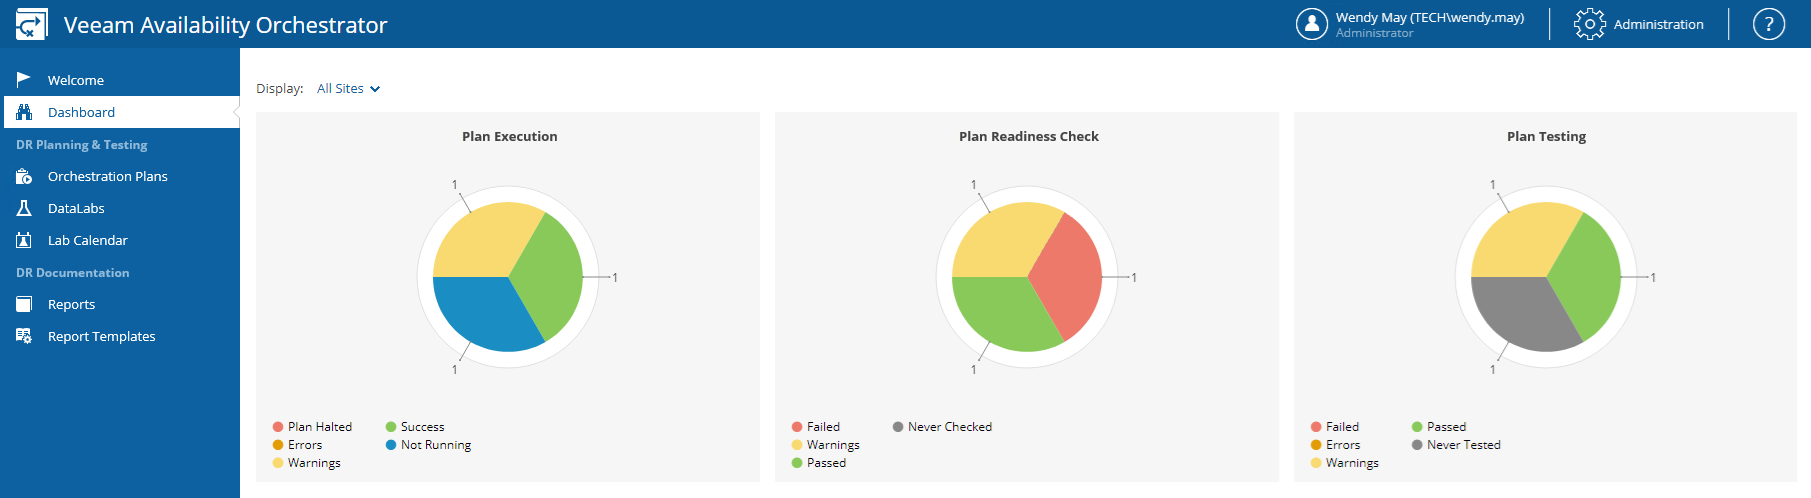
The VAO dashboard provides a plan overview for the selected scope:
- Plan Execution chart displays plan execution results: the number of halted plans, the number of plans completed successfully, the number of plans completed with warnings and the number of plans that have not been run yet.
The worst state of a plan execution is Halted. It means that the plan has stopped processing because of a critical error.
- Plan Readiness Check chart represents the results of readiness check for all plans: the number of failed checks, the number of checks completed successfully, the number of checks completed with warnings and the number of plans that have not been checked yet.
The worst state of a plan readiness check is Failed. It means that the plan is not in the ready-to-run state.
- Plan Testing chart provides the results of plan testing in a DataLab: the number of failed plan tests, the number of plan tests completed successfully, the number of plan tests completed with warnings, the number of plan tests completed with errors, and the number of plans that have not been tested yet.
The worst state of a plan testing is Failed. It means that the test has stopped because of a critical error for a critical VM in the lab.