Viewing Real-Time Session Statistics and Log
You can view real-time statistics for a job session in the Veeam Agent control panel. Veeam Agent shows detailed data for every backup job session: job progress, duration, processing rate, performance bottlenecks, amount of processed data, read and transferred data and details of the session performance, for example, warnings and errors that have occurred in the process of operation.
If you have started the backup job from the Veeam Agent control panel, the current session will be already selected in the list of backup job sessions. Press [Enter] to view the statistics.
If you have started the backup job from the command line, to view detailed information about the currently running backup job session, do the following:
- Launch the Veeam Agent control panel with the veeam or veeamconfig ui command.
- In the Veeam Agent control panel, in the list of backup job sessions, select the currently running session with [Up] and [Down] keys and press [Enter].
|
Tip |
|
You can stop the backup job session at any time. To stop the backup job session, press the [S] key. |
Statistics Counters
Veeam Agent displays jobs statistics for the following counters:
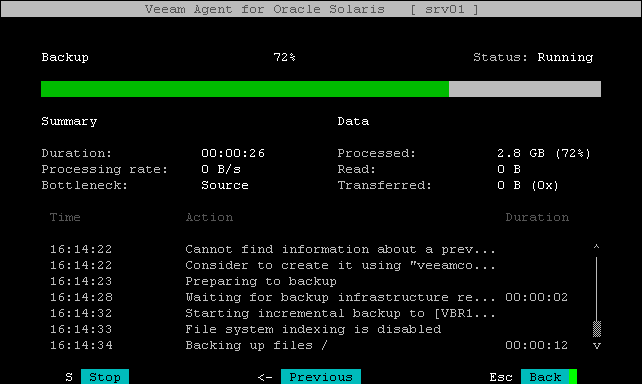
- The pane at the top of the control panel shows information on the job session type, percentage of the job completion and session status. If Veeam Agent operates in the server mode and you have created more than one backup job, the job name also appears on the pane.
- The Summary box shows general information about the job:
- The Data box shows information about processed data:
- Processed — total size of all volumes processed by the job.
- Read — amount of data read from the backed-up volume by Veeam Agent for Oracle Solaris prior to applying compression. For incremental job runs, the value of this counter is typically lower than the value of the Processed counter. Veeam Agent reads only data blocks that have changed since the last job session, processes and copies these data blocks to the target location.
- Transferred — amount of data transferred from the backed-up volume to the backup location after applying compression. This counter does not directly indicate the size of the resulting file(s). Depending on the backup infrastructure and job settings, Veeam Agent can perform additional activities with data, for example, decompress data prior to writing the file to disk. The activities can impact the size of the resulting file.
- The box in the center of the control panel shows the list of operations performed during the job session, their start time and duration time. To scroll the list of operations, use [U]p and [Down] arrow keys on the keyboard.
- The pane at the lower side of the control panel shows help information on how to navigate the control panel.