 This is an archive version of the document. To get the most up-to-date information, see the current version.
Backup Infrastructure
The Backup Infrastructure dashboard provides information about the company and service provider infrastructures.
To access the dashboard:
- Log in to Veeam Availability Console as a Portal Administrator, Site Administrator or Portal Operator.
For details, see Accessing Veeam Availability Console.
- In the menu on the left, click Backup Infrastructure.
- Use tabs at the top to open the necessary dashboard view:
- To show data for a specific Veeam Cloud Connect site, reseller, company and/or location, use the sites, reseller/company and location filters at the top left corner of the Veeam Availability Console window.
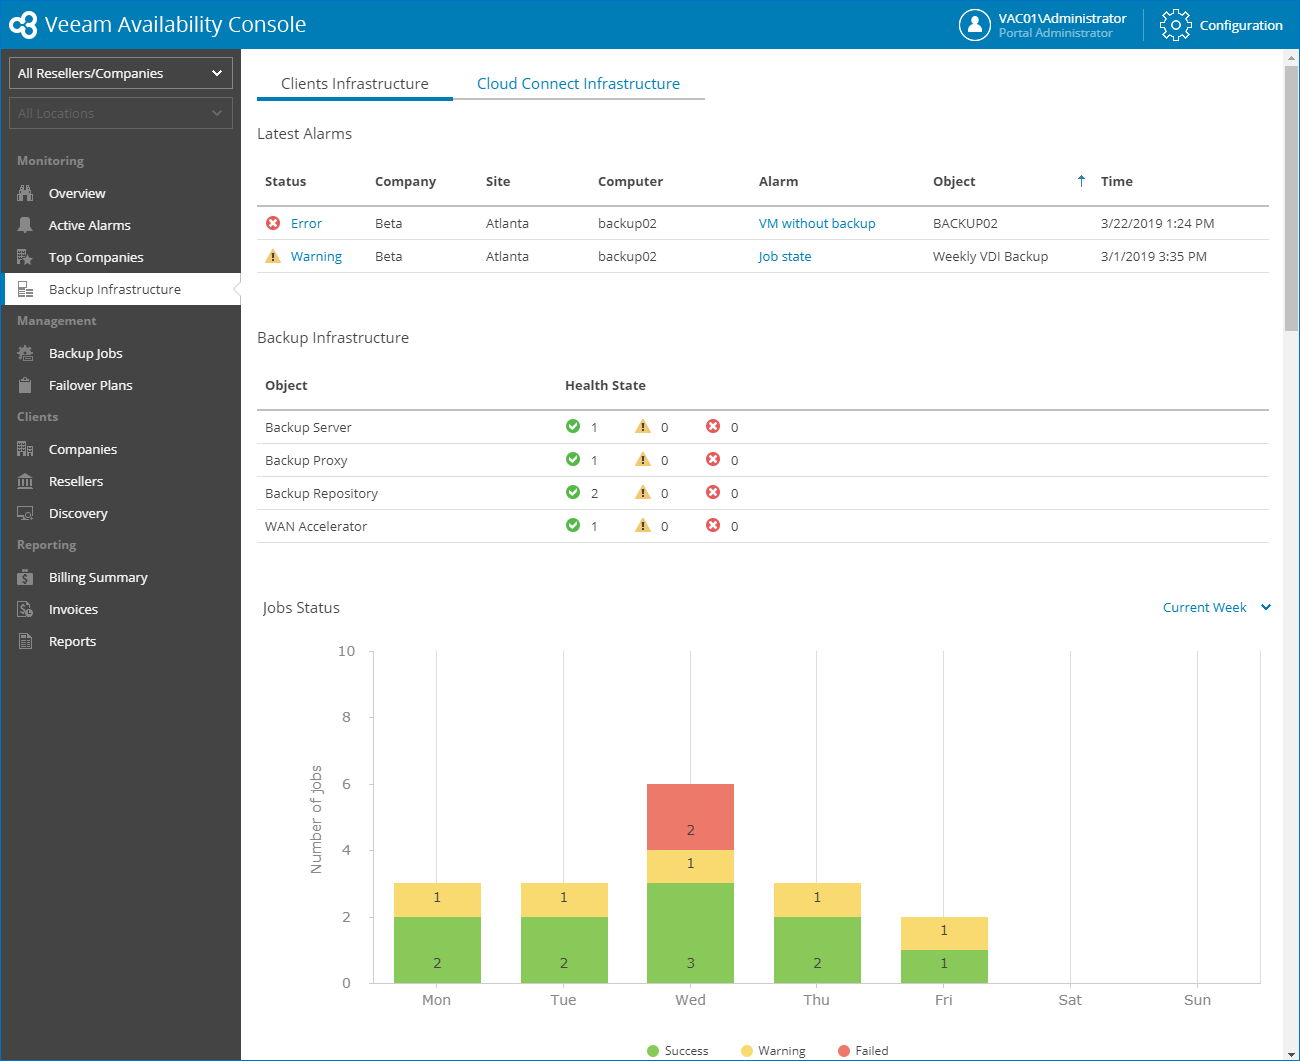
The Clients Infrastructure dashboard provides summary information on the health state, consumed resources and data protection operations for company backup infrastructures.
The dashboard includes the following widgets:
- Latest Alarms widget shows 15 latest warning and error alarms triggered for the chosen companies and locations. For each alarm, the widget details the alarm status, company for which the alarm was triggered, name of a Veeam Cloud Connect site on which the company is registered, name of a computer where the alarm was triggered, alarm name, backup infrastructure object that caused the alarm, and date and time when the alarm was triggered.
Click the link in the Status column to view alarm details. Click the link in the Alarm column to view alarm Knowledge Base article.
For details on Veeam Availability Console alarms, see Working with Alarms.
- Backup Infrastructure widget shows the type and number of components deployed in client Veeam Backup & Replication infrastructures. In addition to inventory statistics, the widget illustrates the connection state of backup infrastructure machines. The connection state helps you quickly detect backup infrastructure machines that can cause interruption or failure of Veeam Backup & Replication tasks.
- Green — the machine is connected and available for data protection operations.
- Yellow — Veeam backup software components (such as Installer, Transport and other) on the machine are out of date.
- Red — connection is lost; the machine is unavailable for data protection operations.
- Job Status widget shows job completion status for Veeam Backup & Replication and Veeam backup agents jobs. The widget chart shows how many jobs completed successfully, ended up with errors and warnings on a specific day of week. For jobs that run more than once a day, the chart reflects the status of the latest job session.
By default, the widget shows job results for the current week. To display job results for the previous week, or for the previous 7 days, use the list next to the widget name.
- Repositories widget shows the list of all cloud and local repositories. For each repository, the widget details a client backup server that connects to the repository, company and location to which the cloud repository belongs, name of a Veeam Cloud Connect site on which the company is registered, amount of allocated space, amount of free space, amount of space consumed by Veeam backup files, and the repository connection state.
- Protected Computers widget shows how many client computers have backup restore points created by Veeam backup agents for the previous month. For each company, the widget details the name of a Veeam Cloud Connect site on which the company is registered, the total number of protected computers, the number of computers protected with Veeam backup agents running in the Workstation mode, and the number of computers protected with Veeam backup agents running in the Server mode.
- Protected VMs widget shows how many client VMs have backup or replica restore points for the previous month.
- Protected value shows the total number of managed VMs that have at least one backup or replica restore point for the previous month.
- Backed Up/Replicated values show the number of managed VMs that have at least one backup/replica restore point for the previous month.
- Cloud Copies value shows the number of VMs that have backup copies stored on a cloud repository.
- Top Jobs by Duration widget shows top 10 Veeam Backup & Replication jobs with the greatest session duration for the past 14 days. For each job, the widget details the job name, a client backup server where the job is configured, company and location to which the job belongs, name of a Veeam Cloud Connect site on which the company is registered, status of the latest job session and average weekly job duration.
The arrows indicate how the average job session duration value has changed in comparison with the duration value for the previous 2 weeks. The horizontal arrow indicates no change, upward pointing arrow stands for increased duration and downward pointing arrow stands for decreased duration.
- Hardware Plan Usage widget shows the amount of consumed resources by companies subscribed to hardware plans. For each company and hardware plan, the widget details the name of a Veeam Cloud Connect site on which the company is registered, the number of configured vCPUs, and the amount of memory and storage consumed by cloud VM replicas.
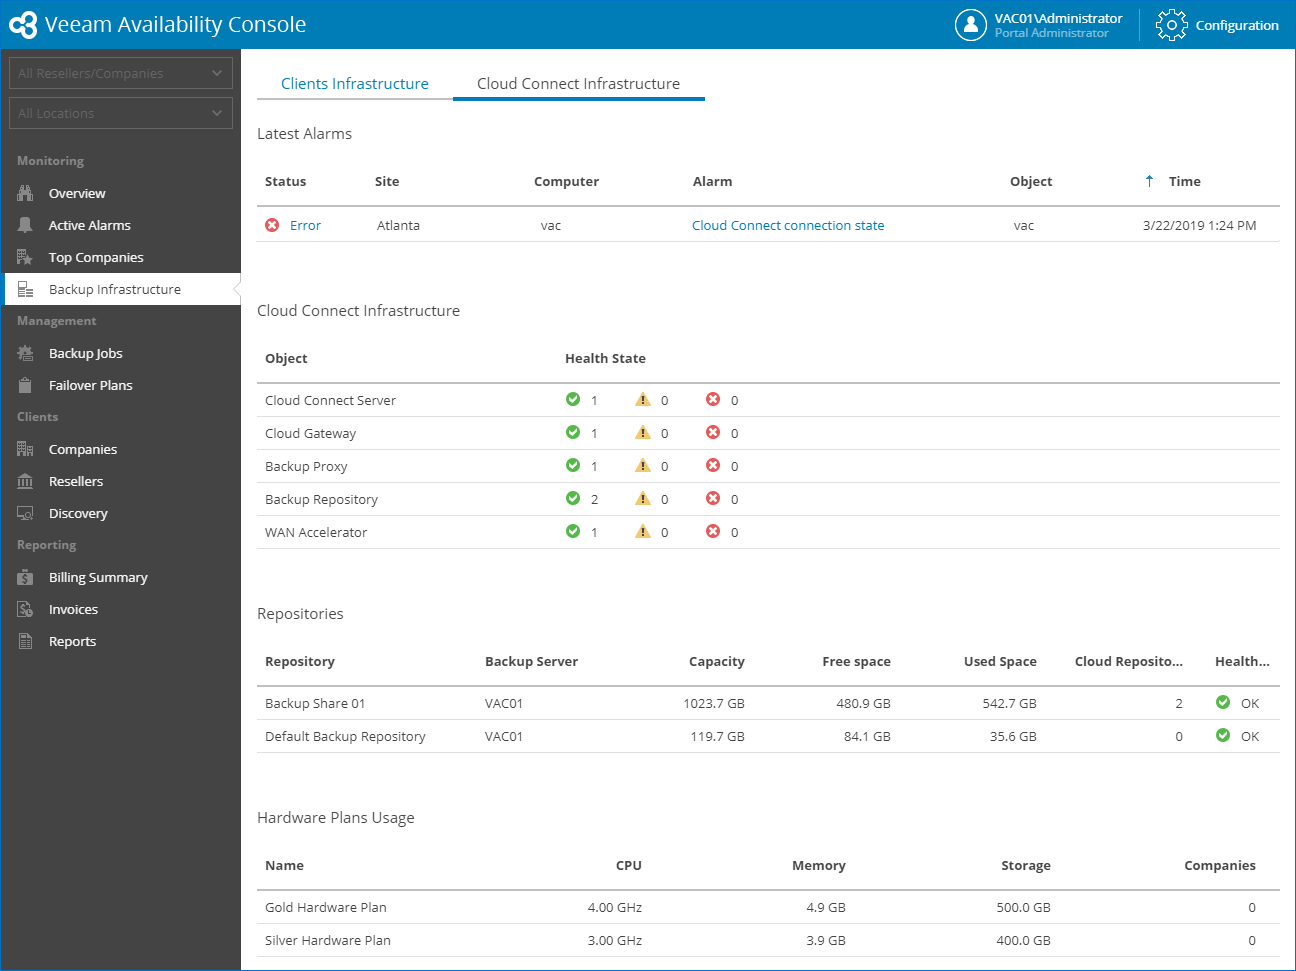
The Cloud Connect Infrastructure dashboard provides information about the Veeam Cloud Connect infrastructure health state, consumed and available repository resources, as well as hardware plan configuration details.
The dashboard includes the following widgets:
- Latest Alarms widget shows 15 latest alarms triggered for the Veeam Cloud Connect infrastructure. For each alarm, the widget details the alarm status, name of a Veeam Cloud Connect site where the alarm was triggered, name of a computer where the alarm was triggered, alarm name, backup infrastructure object that caused the alarm, and date and time when the alarm was triggered.
Click the link in the Status column to view alarm details. Click the link in the Alarm Name column to view alarm Knowledge Base article.
For details on Veeam Availability Console alarms, see Working with Alarms.
- Cloud Connect Infrastructure widget shows the type and number of components deployed in the Veeam Cloud Connect backup infrastructure. In addition to inventory statistics, the widget illustrates the connection state of backup infrastructure machines. The connection state help you quickly detect backup infrastructure machines that can cause interruption or failure of Veeam Backup & Replication tasks.
- Green — the machine is connected and available for data protection operations.
- Yellow — Veeam backup software components (such as Installer, Transport and other) on the machine are out of date.
- Red — connection is lost; the machine is unavailable for data protection operations.
- Repositories widget shows the list of backup repositories in the Veeam Cloud Connect infrastructure. For each backup repository, the widget details the backup repository capacity, amount of free space, amount of space consumed by Veeam backup files, and the backup repository connection state.
- Hardware Plans Usage widget shows configuration details for hardware plans configured in Veeam Cloud Connect. For each hardware plan, the widget details the amount of allocated CPU, memory and storage resources, as well as the number of companies subscribed to the hardware plan.