 This is an archive version of the document. To get the most up-to-date information, see the current version.
Billing Summary
You can view summary information about revenue, invoice statuses, payments and utilized cloud resources in the Billing Summary dashboard.
To access the dashboard:
- Log in to Veeam Availability Console as a Portal Administrator, Site Administrator or Portal Operator.
For details, see Accessing Veeam Availability Console.
- In the menu on the left, click Billing Summary.
- To show data for a specific Veeam Cloud Connect site, reseller and company and, use the sites and reseller/company filters at the top left corner of the Veeam Availability Console window.
The dashboard includes two views — Invoices and Cloud Connect Resources.
Invoices
This dashboard view shows summary information about the revenue state, payments and invoice statuses.
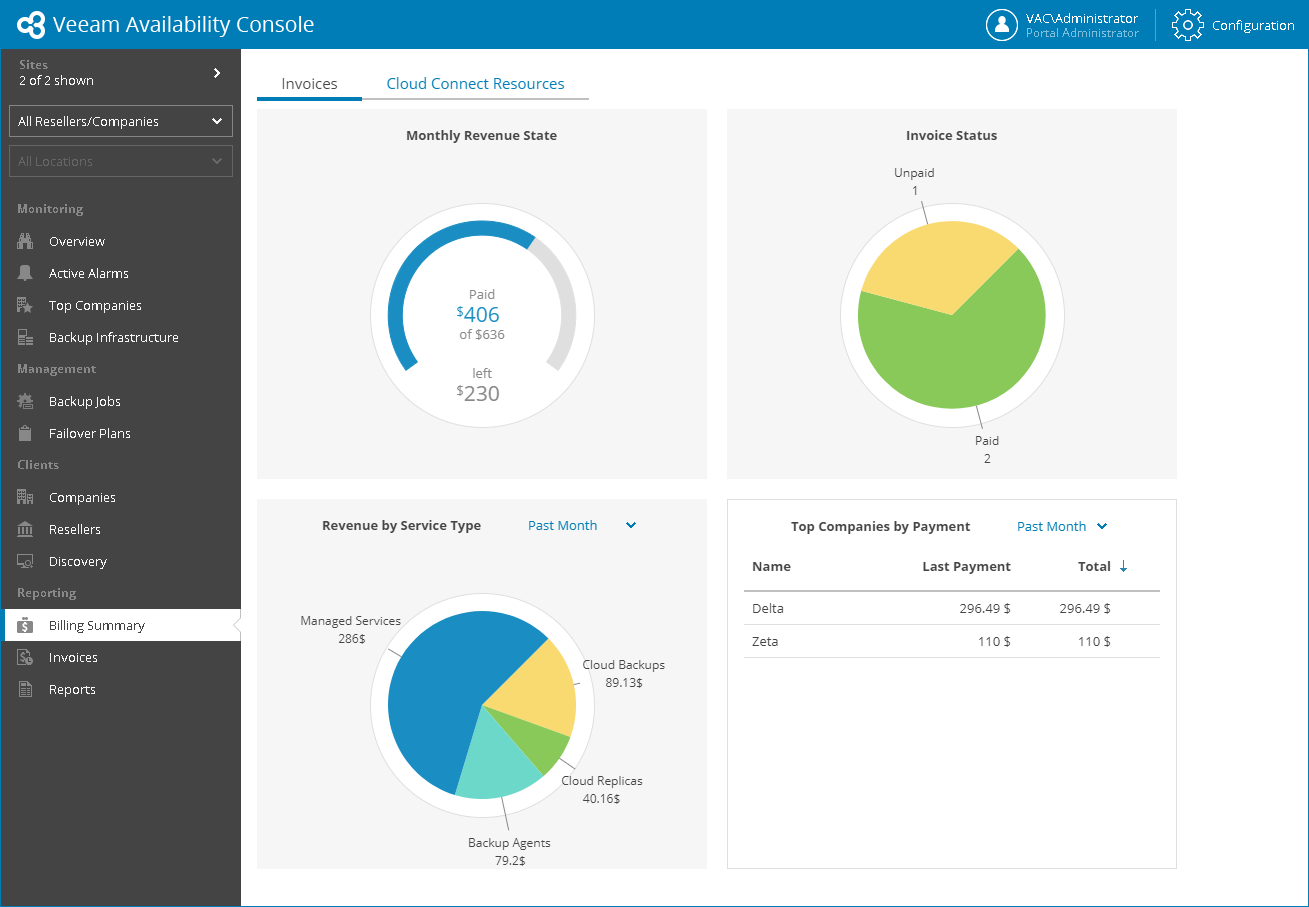
The dashboard view includes the following widgets:
- Monthly Revenue State widget shows the total amount of received payments for the past calendar month, and the total amount of payments in invoices generated during the past calendar month.
- Invoice Status widget shows the number of paid, unpaid and overdue invoices.
- Revenue by Service Type widget shows a breakdown of invoice costs by service.
By default, the widget shows data for the previous calendar month. Use the list next to the widget name to show data for the previous calendar quota or year.
- Top Companies by Payment widget shows 10 companies with greatest payments made. For each company, the widget details the amount of the payment made for the last invoice, and the total amount of payments.
By default, the widget shows data for the previous calendar month. Use the list next to the widget name to show data for the previous calendar quota or year.
Cloud Connect Resources
This dashboard view shows summary information about Veeam Cloud Connect resources consumed by companies.
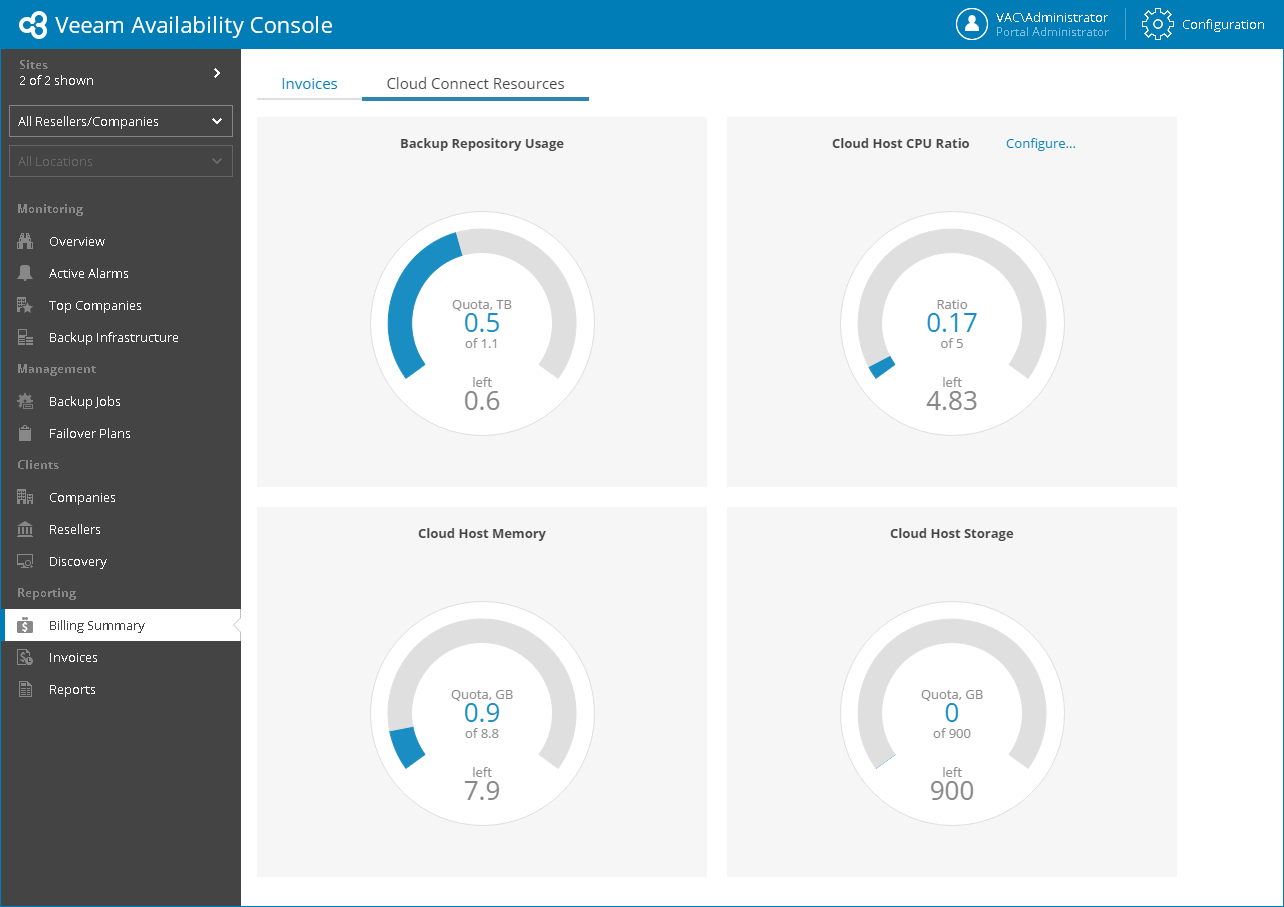
The dashboard view includes the following widgets:
- Backup Repository Usage widget shows the total amount of space available on the service provider backup repositories, the amount of space allocated to companies, and the amount of unallocated space.
- Cloud Host CPU Ratio widget shows the total amount of CPU resources available on cloud hosts, the amount of CPU resources allocated to companies (configured vCPUs), and the amount of unallocated CPU resources.
By default, the widget assumes that the vCPU per core ratio is 5. Click the Configure link next to the widget name to specify a different vCPU per core ratio.
- Cloud Host Memory widget shows the amount of memory resources on cloud hosts, the amount of memory resources allocated to companies, and the amount of unallocated memory.
- Cloud Host Storage widget shows the amount of space on cloud storage that can be used by cloud VM replicas, the amount of space allocated to companies, and the amount of unallocated space.
The widgets of this view allow you to reveal potential problems with overprovisioning of cloud resources: if the amount of allocated resources is greater than 100%, the chart will display an error.