 This is an archive version of the document. To get the most up-to-date information, see the current version.
Top Companies
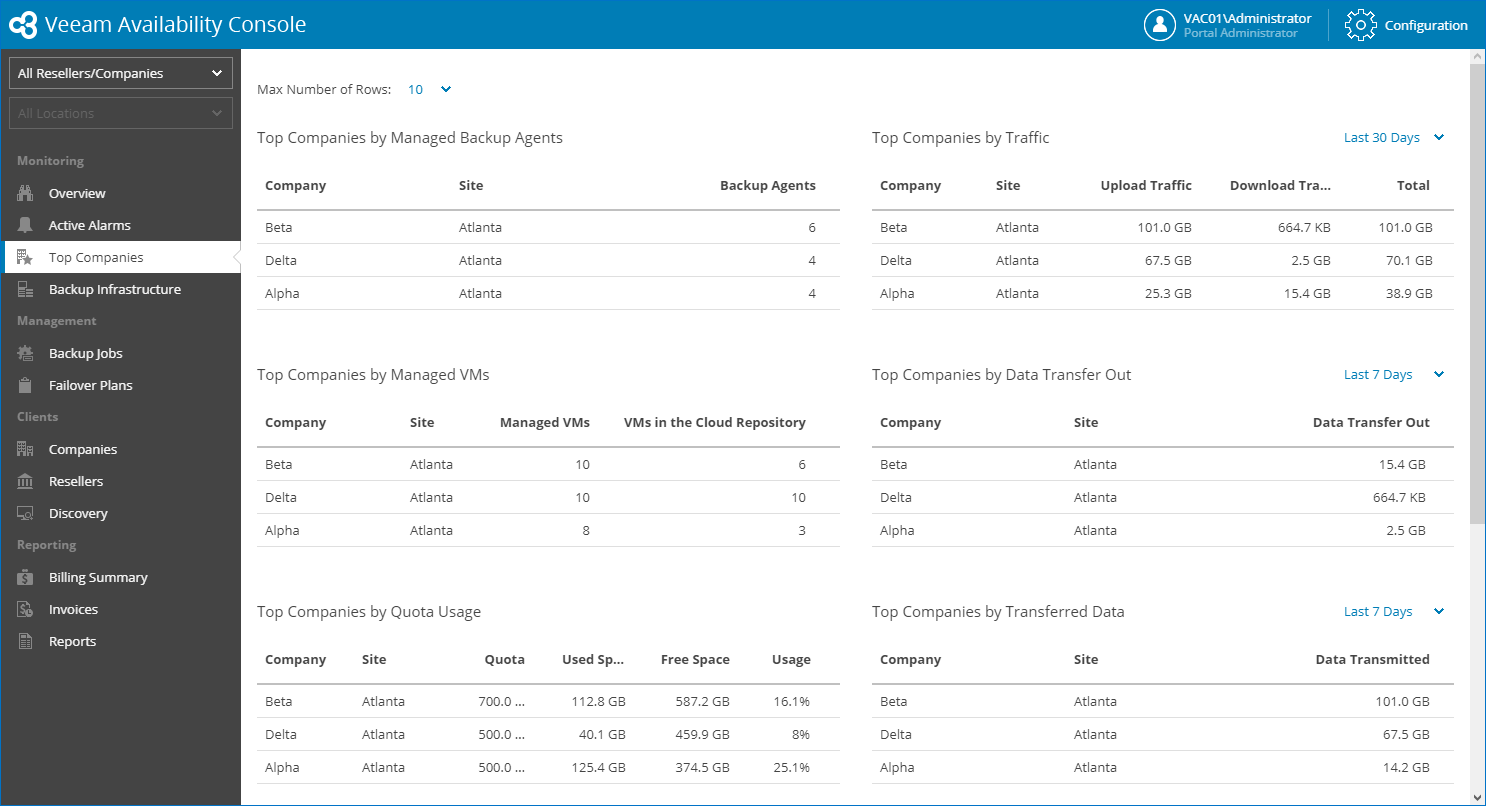
The Top Companies dashboard provides information about top resource consumers among client companies in terms of used cloud resources, managed Veeam backup agents and VMs, transferred data, and so on.
To access the dashboard:
- Log in to Veeam Availability Console as a Portal Administrator, Site Administrator or Portal Operator.
For details, see Accessing Veeam Availability Console.
- In the menu on the left, click Top Companies.
- To show data for a specific Veeam Cloud Connect site, reseller or company, use the sites and reseller/company filters at the top left corner of the Veeam Availability Console window.
- To change the maximum number of rows that widgets can display, use the Max Number of Rows drop-down at the top right corner of the Veeam Availability Console window.
The dashboard includes the following widgets:
- Top Companies by Managed Backup Agents widget shows companies with the greatest number of managed Veeam backup agents.
- Top Companies by Traffic widget shows companies that generated the greatest amount of backup traffic. For each company, the widget details the amount of traffic uploaded to cloud repositories and cloud hosts, and the amount of traffic downloaded from the cloud.
By default, the widget shows traffic for the last 7 days. To display the amount of traffic generated for the last 30 days, use the list next to the widget name.
- Top Companies by Managed VMs widget shows companies with the greatest number of managed VMs. For each company, the widget details the number of managed VMs, and the number of VMs stored in backups in cloud repositories.
- Top Companies by Data Transfer Out widget shows companies that downloaded the greatest amount of data from cloud repositories and cloud storage.
By default, the widget shows data transfer out traffic for the last 7 days. To display the amount of traffic generated for the last 30 days, use the list next to the widget name.
- Top Companies by Quota Usage widget shows companies that consume the greatest amount of cloud repository space, as a percentage of allocated space. For each company, the widget details the cloud repository quota (total allocated space on cloud repositories), total used space in GB, total free space in GB, and percentage of used space.
- Top Companies by Transferred Data widget shows companies that uploaded the greatest amount of data to cloud repositories and cloud hosts.
By default, the widget shows the amount of data transmitted for the last 7 days. To display the amount of data transmitted for the last 30 days, use the list next to the widget name.
- Top Cloud Repositories by Used Space widget shows cloud repositories with the greatest amount of used space, as a percentage of available space. For each cloud repository, the widget details a company to whom the cloud repository belongs, amount of used space in GB, amount of free space in GB, and a percentage of used space.
- Top Companies by Replicated VMs to the Cloud widget shows companies with the greatest number of managed cloud replica VMs.
- Top Companies by N. of Connections widget shows companies that established the greatest number of connections to transfer backup traffic to and from the Veeam Cloud Connect server, and Veeam Availability Console.
By default, the widget shows the number of connections for the last 7 days. To display the number of connections for the last 30 days, use the list next to the widget name.
- Top Hardware Plans by Subscribed Companies widget shows hardware plans with the greatest number of subscribed companies.