Home Page Dashboard
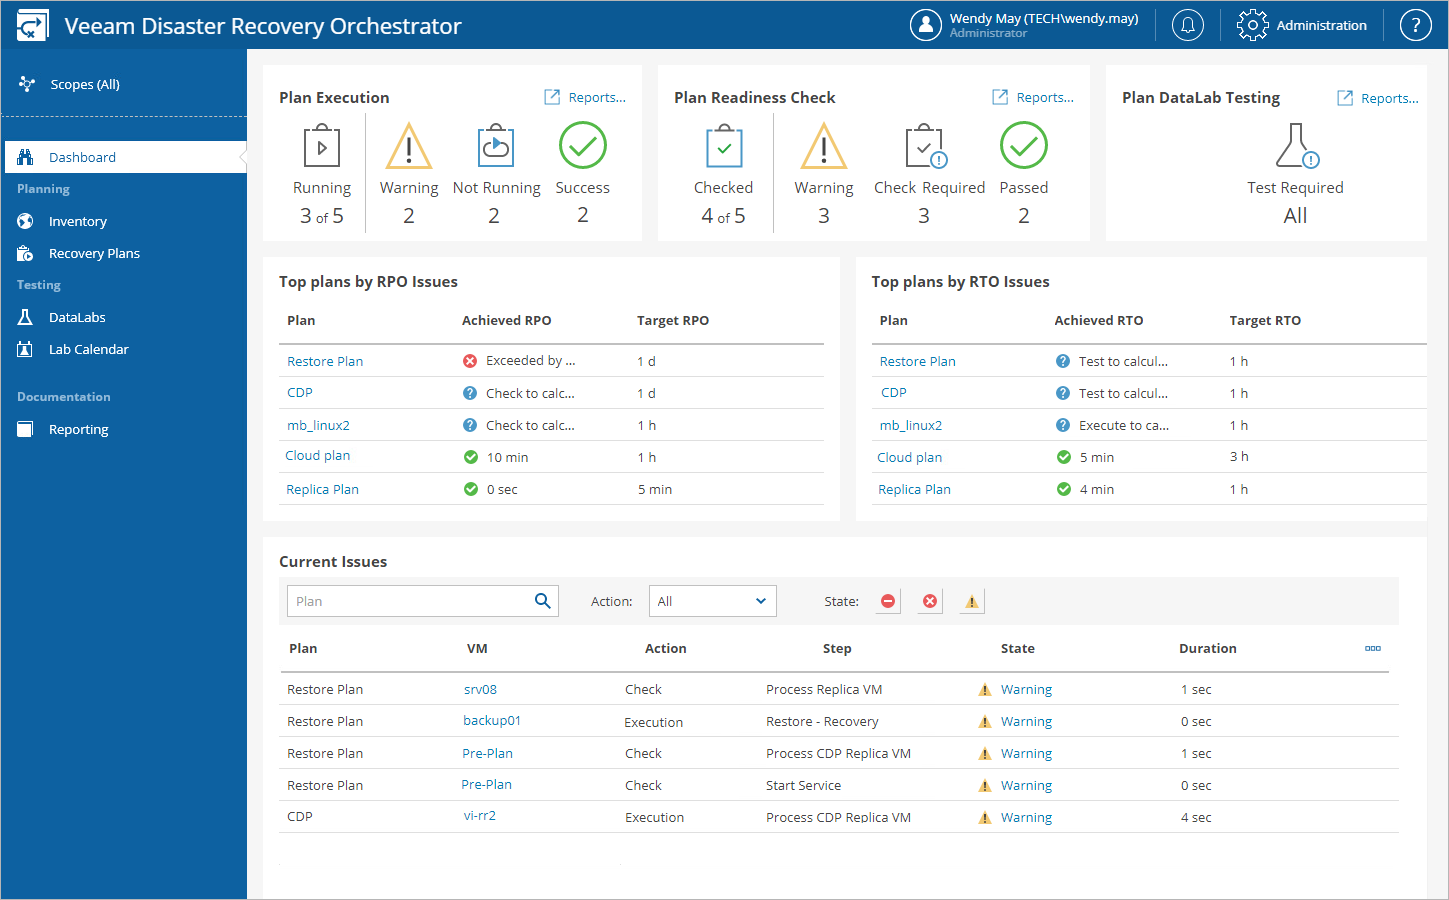
The dashboard on the home tab of the Orchestrator UI provides an overview of all recovery plans for the selected scope:
- The Plan Execution chart shows the number of:
- Halted plans
- Plans completed successfully
- Plans completed with warnings
- Plans not run yet
The worst state of a plan execution is Halted. It means that the plan has stopped processing because of a critical error.
- The Plan Readiness Check chart shows the number of:
- Failed checks
- Checks completed successfully
- Checks completed with warnings
- Checks completed with errors
- Plans not checked yet
The worst state of a plan readiness check is Failed. It means that the plan is not in the ready-to-run state.
- The Plan DataLab Testing chart shows the number of:
- Failed plan tests
- Plan tests completed successfully
- Plan tests completed with warnings
- Plan tests completed with errors
- Plans not tested yet
The worst state of a plan testing is Failed. It means that the test has stopped because of a critical error for a machine from a critical inventory group in the lab.
- The Top plans by RPO Issues and Top plans by RTO Issues panes show top 5 recovery plans with the worst RPO and RTO failures, allowing you to track the achieved objectives versus targets for all plans to ensure you are meeting business service level agreements (SLAs).
- The Current Issues pane provides details on the most recent errors and warnings encountered while executing plans, performing plan testing and running readiness checks.
To switch to the Plan Details page and see the list of issues that occurred while performing plan steps for a problematic machine, click the machine name in the VM column. To read the message of the most recent error or warning that occurred while processing the machine, click the link in the State column.